
Are you curious about how much of your computer’s power is being used right now? Knowing your CPU usage in Linux can help you spot problems, improve performance, and keep your system running smoothly.
You’ll discover simple and effective ways to check your CPU usage quickly. Whether you’re a beginner or just want a clear guide, you’ll find easy steps that anyone can follow. Keep reading to take control of your Linux system and make it work better for you!
Check Cpu Usage With Top Command
The top command is a simple tool to check CPU usage on Linux systems. It shows real-time information about running processes and resource use. This tool helps spot which programs use the most CPU power.
Using top is quick and does not need extra setup. You can see live CPU stats and other system details in one screen. It works well for beginners and advanced users alike.
Running Top For Real-time Stats
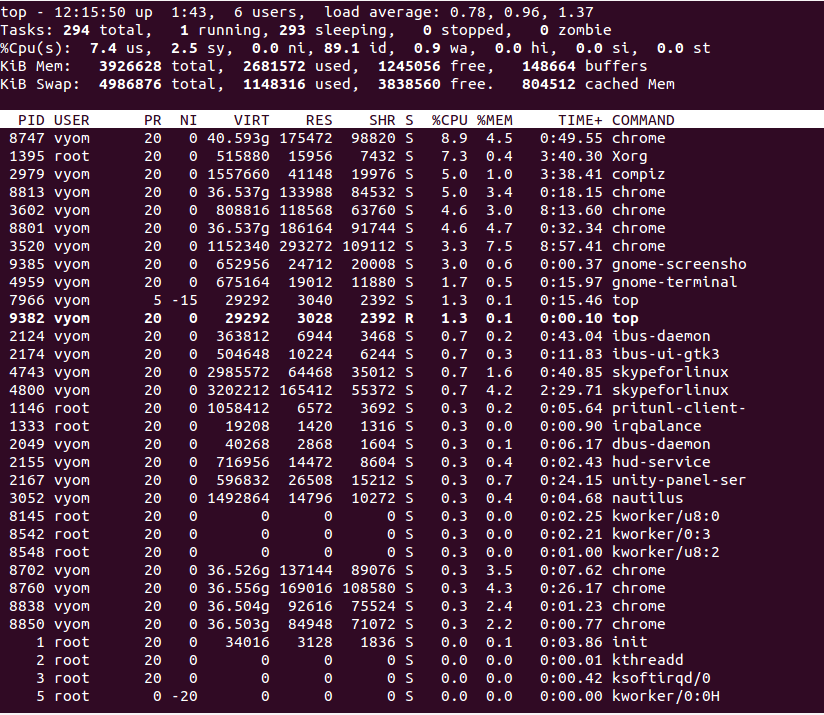
To start top, open the terminal and type top, then press Enter. The screen updates every few seconds with new data. You will see a list of active processes and their CPU use.
The top part of the screen shows overall CPU and memory usage. The bottom lists processes sorted by CPU consumption by default. This helps identify heavy CPU users quickly.
Interpreting Top Output
The first few lines show system summary like CPU, memory, and uptime. CPU usage is split into user, system, and idle percentages. User means normal programs, system means kernel tasks, and idle means free CPU.
Below, the process list shows columns such as PID, user, CPU%, and command name. CPU% tells how much CPU each process uses. High numbers mean the process uses more CPU power.
Customizing Top Display
You can change how top shows information. Press h inside top to see help and key commands. Use f to add or remove columns.
Press z to toggle color mode, making it easier to read. Press 1 to show CPU usage per core. Customize sorting with O or o keys.
To exit top, press q. This simple tool fits many needs for monitoring CPU use quickly.
Credit: phoenixnap.com
Monitor Cpu With Htop Tool
The htop tool is a popular way to monitor CPU usage on Linux systems. It shows real-time information in a clear, colorful interface. This tool helps you see how much CPU your processes use. It also displays memory and system load details.
Using htop makes it easy to track system performance. It works in the terminal and updates continuously. You can manage running processes directly from the tool. This makes htop a handy choice for users who want quick insights into their CPU usage.
Installing Htop On Linux
To use htop, you first need to install it. Most Linux distributions include htop in their package manager. Use simple commands to install it.
For Ubuntu or Debian, type:
sudo apt-get install htopFor Fedora, use:
sudo dnf install htopOn CentOS or RHEL, run:
sudo yum install htopAfter installation, you can start htop by typing htop in the terminal.
Navigating Htop Interface
The htop screen shows a list of running processes. It displays CPU, memory, and swap usage at the top. Each CPU core has its own usage bar.
Processes are color-coded by type. You can scroll the list with arrow keys. The interface updates every few seconds automatically. This helps you see changes in real-time.
Use function keys or shortcuts to access more options. For example, F10 quits the program. The layout is simple and easy to read.
Using Htop Features
htop offers useful features beyond basic monitoring. You can sort processes by CPU, memory, or time used. Press F6 to change sorting options.
You can also kill or renice processes directly. Select a process using arrow keys, then press F9 to kill it.
Use F3 to search for specific processes. This is helpful when many processes run simultaneously.
The tool allows filtering and tree view to see parent-child process relationships. These features make htop a powerful tool for managing CPU usage.
Using Mpstat For Cpu Statistics
Using mpstat is a simple way to check CPU usage on Linux systems. It provides detailed CPU statistics for all processors or specific cores. This tool helps monitor system performance and spot issues early. It is part of the sysstat package, which includes other useful monitoring tools.
Installing Sysstat Package
To use mpstat, first install the sysstat package. Open your terminal and run the command:
sudo apt-get install sysstatThis works for Debian-based systems like Ubuntu. For Red Hat or CentOS, use:
sudo yum install sysstatAfter installation, the mpstat command becomes available.
Running Mpstat Commands
Run mpstat to see CPU statistics. Use this command for basic output:
mpstatThis shows average CPU usage since system start. Add an interval to get ongoing stats, like every 2 seconds:
mpstat 2Press Ctrl+C to stop the output. Use -P ALL to display stats for all CPU cores:
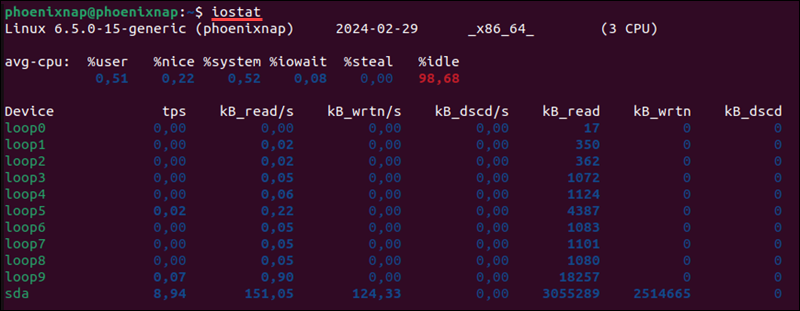
mpstat -P ALL 2Analyzing Mpstat Output
The output lists CPU usage in percentages. Key columns include:
- %usr: Time spent on user processes
- %sys: Time spent on system tasks
- %idle: Time CPU is idle
- %iowait: Time waiting for I/O operations
Look for high %usr or %sys values. Low %idle means CPU is busy. High %iowait suggests disk or network delays. Use these stats to find performance bottlenecks and optimize your system.

Credit: askubuntu.com
Viewing Cpu Usage With Vmstat
Viewing CPU usage with vmstat is a simple way to check how your Linux system performs. This tool shows you real-time data about CPU activity, memory, and system processes. It helps spot slowdowns or heavy CPU use quickly. You do not need extra software, as vmstat is built into most Linux distributions.
Basic Vmstat Usage
To see CPU usage, open a terminal and type vmstat. The command shows a summary of your system’s status. You get information on CPU, memory, and input/output operations. The CPU columns focus on how much time the CPU spends idle, working, or waiting for input/output.
Just typing vmstat shows a snapshot of the current system state. This output updates only once and then stops.
Interpreting Vmstat Data
The CPU section has key columns: us, sy, id, and wa. us shows time spent running user processes. sy means time running system or kernel tasks. id is idle time, when the CPU is free. wa shows time waiting for disk or network.
High us or sy means heavy CPU use. High wa means the CPU waits for slower devices. High id means the CPU is mostly free.
Setting Vmstat Intervals
You can make vmstat update regularly by adding two numbers. The first number sets the delay between updates in seconds. The second number sets how many updates to show.
For example, vmstat 2 5 shows data every 2 seconds, five times. This gives a live view of CPU use over 10 seconds. You can stop it anytime with Ctrl+C.
Using Sar For Historical Cpu Data
Using sar helps you track CPU usage over time. It collects and stores data, showing historical CPU activity. This is useful for spotting trends or problems that happen at certain times. Unlike real-time tools, sar lets you review past CPU performance easily.
Enabling Sar Data Collection
First, check if sar is installed. Install the sysstat package if needed. Enable data collection by starting the sysstat service. This service collects CPU data automatically in the background. Configure the collection frequency in the /etc/sysstat/sysstat file. Set it to collect data every 10 minutes or as you prefer.
Running Sar Commands
Use the sar command to view CPU data. Running sar -u shows CPU usage for the current day. Add options like -f /var/log/sa/saXX to view older logs. Replace XX with the day number. This helps access CPU stats from past days quickly.
Reviewing Cpu Usage History
Analyze the CPU usage reports to find patterns. Look for high usage periods or unusual spikes. Compare daily or weekly reports for trends. Use this data to plan system upgrades or fix issues. Historical data from sar offers clear insights into your CPU’s health.
Graphical Tools For Cpu Monitoring
Graphical tools make it easy to watch CPU usage in Linux. They show real-time data with clear visuals. Users can quickly see how much CPU power their system uses. These tools help spot problems without using commands.
Using Gnome System Monitor
GNOME System Monitor comes pre-installed on many Linux systems. It has a simple interface with tabs for processes and resources. The “Resources” tab displays CPU usage with colorful graphs. Users see overall CPU load and per-core activity. It updates live, so you always get fresh data.
To open it, search for “System Monitor” in your app menu. The tool also shows memory and network usage. It helps users find slow apps and manage system resources easily.
Installing And Using Kde System Monitor
KDE System Monitor works well on KDE desktop environments. It is not always installed by default but easy to add. Use your package manager to install it. For example, run sudo apt install plasma-systemmonitor on Ubuntu.
After installation, launch it from the application launcher. It offers detailed CPU graphs and customizable widgets. You can track CPU load, temperature, and frequency. The clean layout makes monitoring simple for beginners.
Third-party Gui Tools
Many third-party graphical tools show CPU usage on Linux. One popular option is htop with a graphical interface called htop-gtk. It shows CPU cores and usage bars in color.
Another choice is Conky, a lightweight desktop monitor. It displays CPU data directly on your desktop. Conky is highly customizable with simple config files.
These tools add more features and flexibility. They suit users who want extra details or different visuals.
Command-line Scripts For Cpu Alerts
Using command-line scripts to monitor CPU usage in Linux helps you catch problems fast. These scripts run small checks and alert you if CPU use gets too high. You do not need complex tools or software. Just a simple script can do the job.
Such scripts are easy to write and customize. They save time and keep your system healthy. You can run these scripts automatically and get alerts by email or message.
Writing Simple Bash Scripts
Start with a basic bash script to check CPU load. Use the top or mpstat commands to get CPU data. Extract the CPU percentage with simple commands like awk.
Compare this value to a limit you set. If CPU usage is higher, print a warning message. Save this script as a file with .sh extension. Make it executable with chmod +x.
Automating Cpu Checks
Run your script regularly using cron. Cron runs scheduled tasks automatically. Edit the crontab file with crontab -e. Add a line to run the script every few minutes or hours.
This way, your system checks CPU use without you typing commands. You get constant monitoring with little effort. Change the schedule to fit your needs.
Setting Up Notifications
Make your script send alerts when CPU is too high. Use mail or sendmail to send emails from the command line. Add a command in your script after the CPU check.
Write a clear message with the CPU status. Include the time and server name. You can also use other tools like notify-send or messaging APIs.
Notifications help you act quickly. They keep you informed about your system’s health at all times.
Credit: www.atlantic.net
Frequently Asked Questions
How Can I Check Cpu Usage On Linux Terminal?
Use commands like top, htop, or mpstat in the Linux terminal. These tools display real-time CPU usage stats, including user, system, and idle percentages. They help monitor system performance efficiently.
What Is The Best Command To See Cpu Usage In Linux?
The top command is widely used to view CPU usage in Linux. It provides a dynamic, real-time overview of processes and system resource consumption, including CPU load.
Can I Monitor Cpu Usage Graphically In Linux?
Yes, tools like htop and gnome-system-monitor offer graphical CPU usage displays. They provide an interactive and user-friendly way to monitor system performance.
How Often Should I Check Cpu Usage On Linux?
Check CPU usage regularly during heavy tasks or troubleshooting. Frequent monitoring helps identify performance bottlenecks and optimize system resources efficiently.
Conclusion
Monitoring CPU usage in Linux helps keep your system healthy. Simple commands like top and vmstat show real-time data. These tools help find slowdowns and manage tasks better. Regular checks prevent problems before they grow. Practice using these commands to get comfortable.
Soon, checking CPU usage will feel easy and natural. Keep your Linux system running smoothly every day.