
Are you curious about how busy your Linux system really is? Knowing your CPU load helps you understand if your computer is running smoothly or struggling under heavy tasks.
You’ll discover simple and effective ways to see the CPU load on your Linux machine. Whether you’re a beginner or just need a quick refresher, these easy steps will give you clear insights into your system’s performance. Keep reading to take control of your Linux CPU like a pro!
Check Cpu Load With Top Command
The top command is a popular tool to check CPU load in Linux systems. It shows real-time data about system processes and resource usage. You can see how much CPU your system uses and which processes take the most resources.
This command updates every few seconds, giving a live view of your CPU load. It helps identify heavy processes slowing down your system. Learning to use top is a quick way to monitor your Linux CPU load.
Basic Usage Of Top
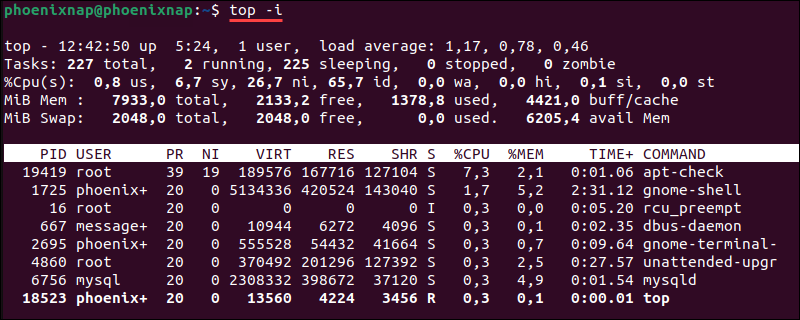
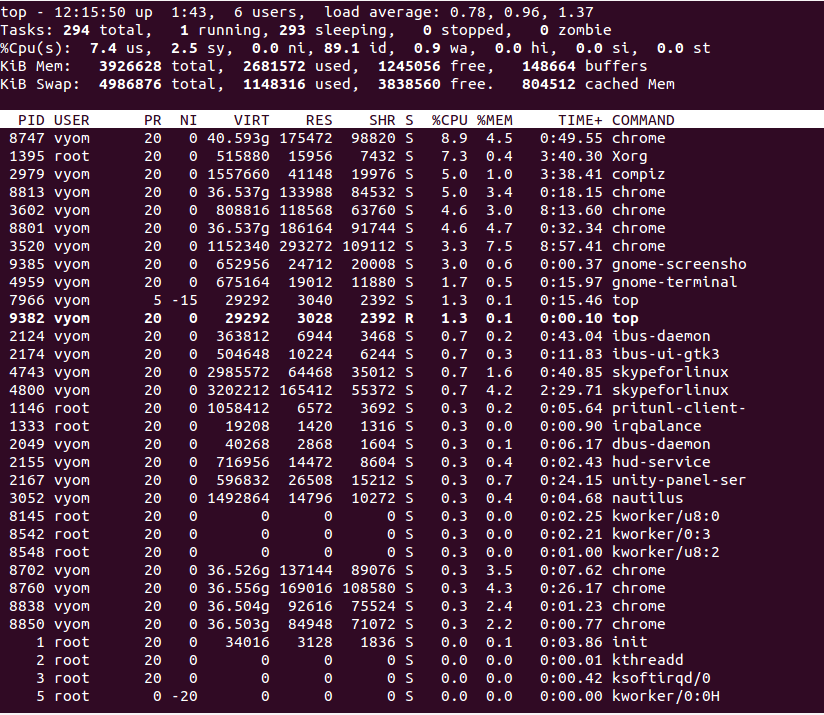
Open your terminal and type top. Press Enter. The screen fills with system information.
At the top, you see CPU, memory, and uptime details. Below, a list of running processes appears. The list updates automatically every few seconds.
Press q anytime to exit the top command and return to the terminal prompt.
Interpreting Cpu Metrics
Look at the line starting with %Cpu(s):. It shows CPU usage split into categories.
us means user processes. sy means system processes. id is idle CPU time. wa shows time waiting for I/O.
High us or sy values show heavy CPU use. High id means the CPU is mostly free.
Customizing Top Display
Press f to enter the field management screen. You can add or remove data columns.
Use arrow keys to move and space to select fields. Press Enter to save.
Press z to toggle color for easier reading. Press 1 to show CPU details per core.
Monitor Cpu Load Using Htop
Htop is a popular tool to monitor CPU load on Linux systems. It shows real-time data in a clear, colorful display. This tool helps you see how busy your CPU is and which processes use the most resources. Htop is easy to use, even for beginners.
Installing Htop
To install Htop, open your terminal. Type sudo apt-get install htop for Debian or Ubuntu. For Fedora, use sudo dnf install htop. On Arch Linux, run sudo pacman -S htop. The installation is quick and straightforward.
Navigating The Interface
After starting Htop with htop, you see a screen with colorful bars and numbers. The top part shows CPU, memory, and swap usage. Below, a list of running processes appears. Use arrow keys to scroll and highlight processes. Press F10 to exit.
Real-time Cpu Monitoring
Htop updates CPU load every second. The CPU bars show usage for each core separately. Different colors indicate user, system, and idle time. You can spot high CPU usage fast. This helps find processes slowing down your system.
View Cpu Load With Mpstat
Mpstat is a simple tool to check CPU load on Linux systems. It shows how busy each CPU core is. You can find out if your system is running smoothly or if it is overloaded. Mpstat gives real-time data and is easy to use. It helps in spotting CPU problems fast.
Installing Mpstat
Mpstat is part of the sysstat package. Most Linux distributions do not install it by default. To add mpstat, open your terminal. Use the command for your system:
For Ubuntu or Debian:
sudo apt-get install sysstatFor CentOS or RHEL:
sudo yum install sysstatAfter installation, enable the sysstat service if needed. Now, you can use mpstat to monitor CPU load.
Running Basic Cpu Reports
Start mpstat by typing mpstat in the terminal. This shows CPU usage since the system started. To see real-time data, use:
mpstat 1 5This command displays CPU stats every second, five times. It shows user, system, idle, and iowait percentages. These numbers help understand how CPU time is spent.
Analyzing Cpu Usage Patterns
Look at the CPU states to find issues. High “usr” means many user processes are running. High “sys” shows heavy system tasks. High “idle” means the CPU is free. Watch “iowait” for delays caused by disk or network. Consistent high usage may signal a bottleneck. Use mpstat regularly to track CPU changes.
Use Vmstat For Cpu Insights
Using vmstat gives clear insights into CPU load on Linux systems. This tool shows real-time information about system processes, memory, and CPU activity. It helps track how busy the CPU is and identifies performance issues fast.
vmstat runs in the terminal and displays data in an easy-to-read format. The numbers update regularly, giving a snapshot of the current CPU state. It is useful for both beginners and advanced Linux users.
Understanding Vmstat Output
The vmstat output has several columns showing different system stats. Focus on the CPU section to understand load.
us: Time spent running user processes.sy: Time spent on system (kernel) tasks.id: Idle CPU time.wa: Time waiting for I/O operations.
A high us or sy value means the CPU is busy. High id means the CPU is mostly idle. Watch wa to see if the CPU waits on disk or network tasks.
Tracking Cpu Performance Over Time
Run vmstat 2 to update stats every two seconds. This lets you see changes over time.
Look for trends like rising CPU usage or long wait times. Sudden spikes can show heavy processes or issues.
Save output to a file for later analysis. Use commands like vmstat 2 10 > vmstat.log to collect data.
Review the log to find patterns and understand CPU behavior during different workloads.
Read Cpu Load From /proc/loadavg
Reading CPU load from /proc/loadavg is a quick way to check your Linux system’s performance. This file holds essential data about the system’s workload. It updates in real-time, showing how busy your CPU is.
This method does not require special tools or commands. Just a simple read of the file can give you a snapshot of the CPU load. It works on almost all Linux distributions and is very lightweight.
Accessing Load Average Data
Open a terminal window to access load average data. Use the command cat /proc/loadavg to display the content of this file. The output shows several numbers separated by spaces.
You can also use head -n 1 /proc/loadavg to get the first line only. This line contains the main load average numbers you need.
Decoding Load Average Numbers
The first three numbers represent the load average over different time frames. They show the average number of processes running or waiting.
The values correspond to the last 1, 5, and 15 minutes. Lower numbers mean the CPU is less busy. Higher numbers indicate more workload and possible slowdowns.
Understanding these numbers helps you monitor system health. It shows if your CPU is under stress or running smoothly. The remaining numbers give extra details about running processes and the last process ID used.

Credit: www.cyberciti.biz
Automate Cpu Load Monitoring
Automating CPU load monitoring helps keep your Linux system stable. It saves time and alerts you to problems fast. Automation lets you track CPU use without checking manually. This way, you can act before issues grow.
Setting Up Cron Jobs
Cron jobs run tasks at set times. Use cron to check CPU load regularly. Write a command that logs CPU usage. Schedule it to run every minute or hour. This keeps a history of CPU load trends. You can review logs to find patterns or spikes. Cron jobs run in the background without user help.
Using Scripts For Alerts
Scripts can watch CPU load and send alerts. Create a script to check CPU usage numbers. If load goes above a limit, the script sends a warning email. You can use simple shell scripts or Python. Run the script with cron for automatic checks. Alerts help you fix issues before they cause downtime. Scripts make monitoring active, not just passive.
Tips For Accurate Cpu Load Analysis
Accurate CPU load analysis helps understand system performance better. It guides decisions on optimizing processes and managing resources. Small mistakes can lead to wrong conclusions. Follow simple tips to get clear and precise CPU load data.
Avoiding Common Pitfalls
Check CPU load over time, not just once. Instant values can mislead. Short spikes often confuse the real load. Use consistent intervals for sampling data. Watch out for background tasks that affect readings. Close unnecessary programs before measuring. Avoid relying on a single tool alone. Each tool may show slightly different results.
Combining Multiple Tools
Use more than one tool to cross-check CPU load. Tools like top, htop, and vmstat provide different views. Some show real-time data, others show averages. Compare their outputs to understand trends. Combining tools gives a fuller picture. Helps spot issues that one tool might miss.
Credit: phoenixnap.com
Credit: www.atlantic.net
Frequently Asked Questions
How Do I Check Cpu Load In Linux Terminal?
You can check CPU load using the top or uptime commands in the terminal. Both provide real-time CPU load averages and system performance details.
What Is The Best Command To See Cpu Usage?
The top command is the best for detailed CPU usage. It shows processes, CPU load, memory use, and system uptime in real-time.
How Can I View Cpu Load Averages On Linux?
Use the uptime or cat /proc/loadavg commands. They display CPU load averages over 1, 5, and 15 minutes intervals.
Can I Monitor Cpu Load With Graphical Tools?
Yes, tools like htop and gnome-system-monitor provide interactive, graphical views of CPU load and system resources.
Conclusion
Monitoring CPU load in Linux helps keep your system healthy. You can check it using simple commands like top or uptime. These tools show real-time data about your CPU use. Regular checks help you spot problems early. This way, your Linux system runs smoothly and fast.
Start using these commands today to stay informed. It’s easy and useful for every Linux user. Keep an eye on your CPU load to avoid slowdowns. Simple steps make a big difference in system performance.