
Are you noticing your Linux system slowing down or acting strangely? Understanding how your CPU is being used is the first step to fixing those issues.
Monitoring CPU usage in Linux isn’t as complicated as it sounds, and once you know how to do it, you can keep your system running smoothly and avoid unexpected crashes. You’ll discover simple, effective ways to check your CPU performance right now.
Keep reading, and you’ll gain the confidence to take control of your Linux system’s health.
Credit: www.atlantic.net
Why Monitor Cpu Usage
Monitoring CPU usage in Linux helps keep your system healthy and fast. It shows how much work the CPU does at any time. This helps find problems early and avoid crashes. Knowing CPU use helps manage tasks better.
Understanding System Performance
CPU usage tells how well your system runs. High CPU use means many processes need attention. Low CPU use may show idle time or fewer tasks. Tracking this helps balance workload efficiently.
Preventing Overheating
CPUs get hot when busy. Overheating can damage hardware or slow the system. Watching CPU use helps spot overheating risks. You can cool the system before damage starts.
Detecting Unusual Activity
Sudden spikes in CPU use may signal malware or faulty programs. Monitoring CPU helps catch these issues fast. Early detection protects your data and system health.
Improving Energy Efficiency
High CPU use drains battery and power. Watching CPU use helps save energy. It lets you adjust tasks to extend battery life.
Optimizing Software Performance
Developers and users see how apps affect CPU. This helps improve software speed and stability. Monitoring CPU aids in tuning programs for best results.
Common Cpu Metrics
Understanding common CPU metrics helps you see how your Linux system uses its processor. These metrics show how much work your CPU does and where it spends its time. Watching these numbers helps find performance issues early.
User Vs System Time
User time is the CPU time spent on programs you run. System time is the CPU working on core Linux tasks. Higher user time means your apps use more CPU. High system time shows the OS is busy managing resources.
Idle And Wait Time
Idle time means the CPU is not doing any work. Wait time shows the CPU is waiting for input/output like disk or network. A high idle time means your CPU is free. High wait time can slow your system down.
Load Average
Load average shows the average number of processes waiting for CPU. It is given for 1, 5, and 15 minutes. A load of 1 means one process is ready to run. More than the number of CPU cores means overload.
Using Top Command
The top command is a popular tool to check CPU usage in Linux. It shows real-time system information clearly. Many users prefer top because it is easy to use and always available.
This command helps monitor processes and CPU load quickly. It updates the display every few seconds. You can see which processes use the most CPU power.
Basic Usage
Open your terminal and type top, then press Enter. The command starts showing live system data. Look at the top area for CPU and memory use.
To stop top, press the q key. This command runs in the terminal until you exit.
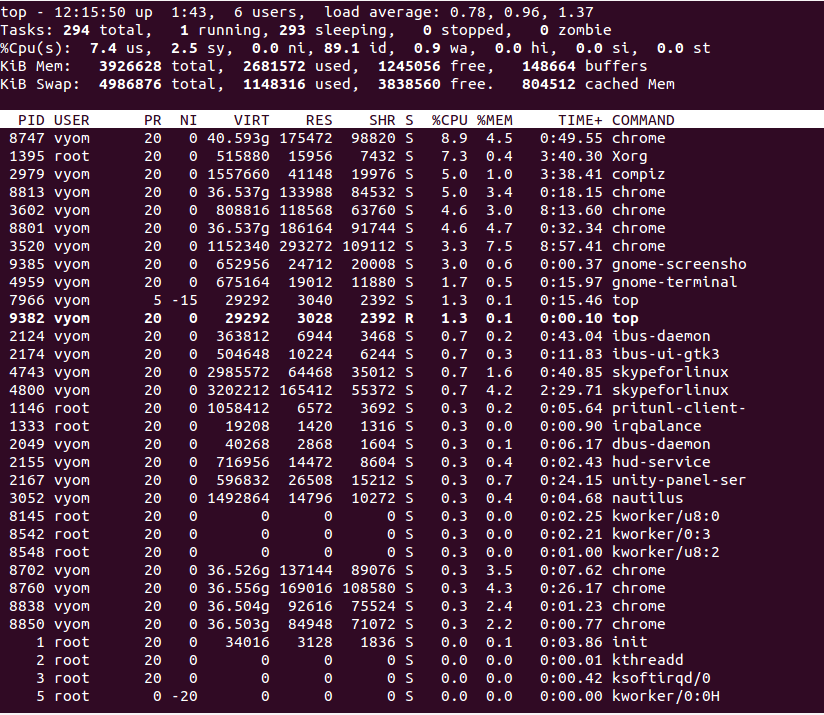
Interpreting Output
The CPU usage appears in a line starting with %Cpu(s):. It shows various percentages like user, system, and idle time.
User time means CPU used by programs. System time means CPU used by the operating system. Idle time is when CPU is free.
Check the process list below to see CPU use by each task. The %CPU column shows CPU use per process.
Customizing Display
You can change what top shows by pressing keys during execution. Press c to show full command lines of processes.
Press 1 to see CPU usage for each core separately. Sort processes by CPU use with P.
Use h for help and see all key options. Press q to quit and return to the shell.
Using Htop For Visual Monitoring
Htop offers a clear and interactive way to watch your CPU use on Linux. It shows real-time data with colors and bars. This visual style helps understand the load quickly. Htop works in the terminal but feels much easier than other tools.
You can see all running processes and their CPU use at a glance. It updates every few seconds to keep info fresh. The interface lets you sort and find processes fast. This makes it simpler to spot which apps use the most CPU power.
Installing Htop
Open your Linux terminal. Type sudo apt-get install htop for Debian-based systems. For Red Hat-based systems, use sudo yum install htop. Wait a moment for the install to finish. Now, type htop to start the program.
Navigating Interface
The top of the screen shows CPU, memory, and swap usage. Bars change color based on load level. Below, a list of processes runs with their details. Use arrow keys to scroll up and down. Press F10 or q to quit anytime.
Filtering Processes
Press F3 to search for a process by name. Enter part of the name to filter the list. This helps find CPU-heavy apps fast. Press F4 to filter by other criteria. It is useful to focus on specific tasks or users.
Checking Cpu With Vmstat
Monitoring CPU usage is essential for managing Linux system performance. vmstat is a simple tool that helps track CPU activity. It shows real-time data about processes, memory, and CPU usage. Using vmstat gives a quick overview of how your CPU handles tasks.
Command Syntax
The basic syntax for vmstat is easy to remember.
vmstat [delay] [count]Delay sets seconds between updates. Count is how many times data shows.
For example, vmstat 2 5 shows CPU stats every 2 seconds, 5 times.
Running vmstat without arguments shows average since last reboot.
Key Fields To Watch
Focus on these fields for CPU monitoring:
- us: Time CPU spends on user processes.
- sy: Time spent on system (kernel) tasks.
- id: Idle time when CPU is free.
- wa: Time waiting for I/O operations.
High us or sy means heavy CPU use.
High wa suggests delays from disk or network.
Low id shows CPU is busy all the time.

Credit: www.cyberciti.biz
Using Mpstat For Detailed Stats
Using mpstat gives you detailed CPU usage stats on Linux. It provides data on each CPU core separately. This helps you see how busy each core is. You can spot any core that is working too hard or too little.
mpstat shows CPU time spent on different tasks. These include user processes, system processes, and idle time. It updates the stats at regular intervals. This makes it easier to track CPU performance over time.
Installation And Usage
To use mpstat, first install the sysstat package. On most Linux systems, run:
sudo apt-get install sysstatAfter installation, you can run mpstat with a simple command:
mpstat 1 5This command shows CPU stats every second for five times. Adjust the numbers to change how often and how long you monitor.
Analyzing Cpu Cores
mpstat breaks down CPU usage by core. Each core has its own row in the output. Look for high percentages in the %usr (user time) or %sys (system time) columns.
High %idle means the CPU core is not busy. Low %idle means the core is working hard. Use this info to balance the load across cores or find slowdowns.
Monitoring Via /proc/stat
Monitoring CPU usage in Linux can be done through the /proc/stat file. This file holds important data about the system’s CPU activity. It updates continuously and shows how much time the CPU spends on different tasks. This method is simple and does not require extra tools.
By reading /proc/stat, you can see raw CPU time information. These details help calculate CPU load and understand system performance. It is useful for developers, system admins, or anyone curious about their machine’s health.
Accessing The File
Open a terminal on your Linux machine. Type cat /proc/stat and press Enter. This command displays the content of the file.
You can also use text editors like nano or vim to open the file. It is a plain text file, easy to read and parse.
Reading Cpu Data
The first line starts with cpu and shows aggregated data for all CPUs. Numbers represent time spent in user mode, system mode, idle, and more.
Each number counts jiffies, a unit of time ticks. Higher values mean more CPU time spent in that mode.
Compare values over time to see CPU usage changes. Calculate the difference between two readings for accurate CPU load.
Credit: phoenixnap.com
Setting Up Alerts For High Cpu
Setting up alerts for high CPU usage helps prevent system slowdowns and crashes. Early warnings let you act fast. You can use simple tools to get alerts on your Linux system. This keeps your server or computer running smoothly.
Using Shell Scripts
Create a shell script to check CPU load regularly. Use the top or mpstat command inside the script. Compare CPU usage against a set limit. If the limit is exceeded, send an alert by email or log the event.
For example, a script can use grep and awk to find CPU usage. Then, an if condition triggers the alert. Save the script and make it executable with chmod +x. This method is simple and effective.
Integrating With Cron
Use cron to run your shell script automatically. Schedule the script to run every few minutes or hours. This helps monitor CPU usage without manual checks.
Edit the crontab file with crontab -e. Add a line to run the script at your chosen interval. The cron job runs quietly in the background. Alerts will come only when CPU load is too high.
Graphical Tools For Beginners
Graphical tools make monitoring CPU usage easier for Linux beginners. These tools show information visually. Users can see CPU activity in real-time without using commands. They help understand system performance quickly. Two popular graphical tools are GNOME System Monitor and KSysGuard. Both are easy to use and come pre-installed on many Linux distributions.
Using Gnome System Monitor
GNOME System Monitor is simple and user-friendly. It displays CPU, memory, and network usage. The CPU tab shows how much of the CPU is in use. It updates every few seconds to show current activity. Users can also see running processes and their CPU consumption. This helps find programs that use too much CPU. The interface is clean and easy to navigate. Beginners can quickly learn to check CPU status with this tool.
Ksysguard Overview
KSysGuard is another useful tool for CPU monitoring. It is common in KDE desktop environments. The tool displays detailed CPU usage graphs. Users can watch all CPU cores separately. It also shows memory and network usage. KSysGuard allows users to set custom monitoring views. This makes it flexible for different needs. The interface is a bit more advanced but still clear. Beginners can use it to get detailed CPU information visually.
Tips For Efficient Cpu Monitoring
Monitoring CPU usage in Linux helps keep your system fast and stable. Efficient monitoring saves time and catches issues early. Using the right methods makes tracking simple and clear. Below are some tips for effective CPU monitoring that improve your workflow.
Automating Reports
Set up scripts to collect CPU data regularly. Automate reports to run at fixed times like daily or weekly. Use tools like cron jobs to schedule these tasks. Automatic reports reduce manual work and avoid missed checks. Receive alerts if CPU usage goes beyond safe levels. This way, you act before problems grow.
Combining Tools
Use more than one tool for better CPU monitoring. Tools like top, htop, and vmstat show different details. Combine them to get a full view of CPU health. Some tools focus on real-time data, others on logs. Mixing tools helps spot patterns and unusual activity fast. This approach gives clear insight and better control.
Frequently Asked Questions
What Tools Can I Use To Monitor Cpu Usage In Linux?
You can monitor CPU usage using tools like top, htop, vmstat, and mpstat. These provide real-time CPU performance data. They help identify processes consuming high CPU resources efficiently.
How Do I Check Cpu Usage With The Top Command?
Run the top command in the terminal. It shows CPU usage percentages, running processes, and system load. Press ‘q’ to exit the interface.
Can I Monitor Cpu Usage Remotely On Linux?
Yes, you can use SSH to access Linux servers remotely. Then, run CPU monitoring commands like top or htop to check usage remotely.
What Does High Cpu Usage Indicate On Linux?
High CPU usage often means heavy processing or inefficient programs running. It can slow down your system and may require process optimization or termination.
Conclusion
Monitoring CPU usage in Linux helps keep your system healthy. Use simple commands like top, htop, and mpstat to check performance. Watch for high CPU use to avoid slowdowns. Regular checks catch problems early and save time. Understanding these tools makes managing Linux easier.
Start monitoring today for smoother system work.