
Are you wondering how busy your Linux system’s CPU really is? Knowing your CPU utilization is key to keeping your computer running smoothly and avoiding slowdowns.
Whether you’re a beginner or have some experience, understanding how to check CPU usage can help you spot problems early and make your system more efficient. You’ll discover simple and effective ways to monitor your CPU utilization in Linux, using easy commands and tools.
By the end, you’ll feel confident managing your system’s performance like a pro. Ready to take control of your Linux CPU? Let’s dive in!
Check Cpu Usage With Top Command
The top command is a popular tool to check CPU usage on Linux. It shows real-time system information and running processes. You can see how much CPU each process uses and overall system load. This helps to find if your CPU is busy or idle.
Using top is simple and fast. It works on almost all Linux systems without extra setup. Let’s explore how to use it effectively.
Basic Top Command Usage
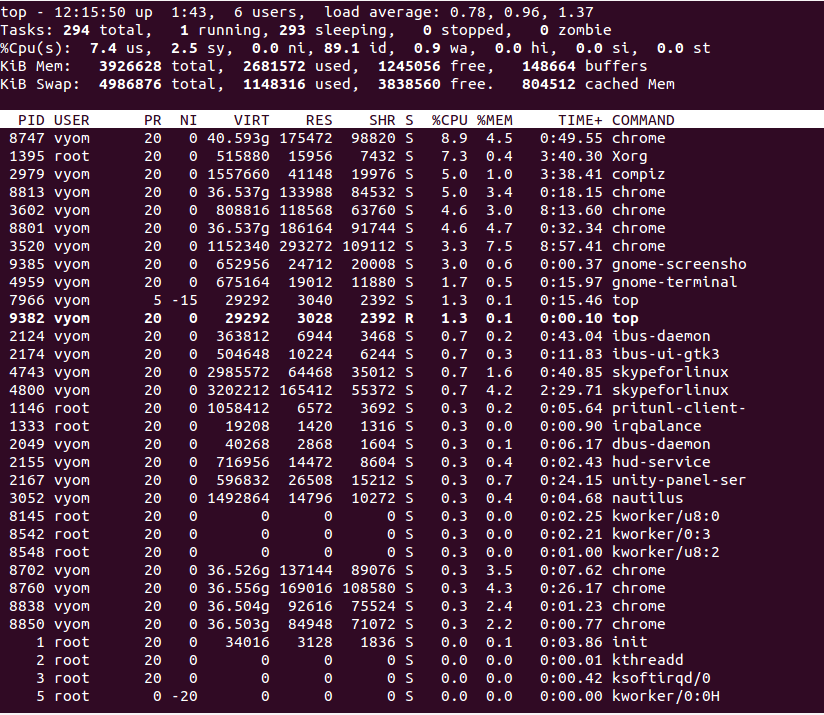
To start, open a terminal and type top. Press Enter to run the command.
You will see a list of processes and system stats. The screen updates every few seconds. Press q to quit top.
This view shows CPU, memory, and process details live. It helps monitor system performance easily.
Interpreting Cpu Metrics
Look at the top lines of the top output. These show CPU usage summary.
CPU usage is split into different categories like user, system, and idle. User means CPU time used by applications. System means CPU time for system tasks. Idle shows free CPU time.
High user or system values mean CPU is busy. High idle means CPU is free.
Customizing Top Output
You can change top display for better info. Press 1 to see CPU use for each core.
Press f to add or remove columns. Use arrow keys to choose fields. Press Enter to save changes.
Press Shift + W to save your settings for future use.
Monitor Cpu With Vmstat
Monitoring CPU usage is important for managing your Linux system’s performance. vmstat is a simple tool that shows real-time CPU statistics. It helps track how busy your CPU is and how well your system handles tasks.
Using vmstat, you get a quick view of CPU activity. This tool displays useful data about processes, memory, paging, and CPU usage. It is easy to run and understand, making it great for beginners.
Running Vmstat For Cpu Stats
Open your Linux terminal to use vmstat. Type vmstat 1 5 to see CPU stats every second for five times. The first line shows averages since last reboot. Next lines show real-time data.
The command format is simple: vmstat [delay] [count]. Delay sets seconds between updates. Count is how many times to show the stats. This lets you watch CPU use over time.
Key Cpu Fields To Watch
Focus on these fields in vmstat output:
- us: Time CPU spends on user processes.
- sy: Time CPU uses for system tasks.
- id: Time CPU is idle and not busy.
- wa: Time CPU waits for input/output operations.
- st: Time stolen from a virtual machine by the host.
High us or sy means CPU is busy. High id means CPU is free. Watch wa to see if disk or network slows CPU.
Use Mpstat For Detailed Cpu Info
Mpstat is a useful tool to check CPU usage on Linux. It shows detailed information about processor activity. This helps understand how much work the CPU is doing. You can see usage per core or overall. It gives real-time stats and historical data. This makes Mpstat perfect for monitoring system performance.
Installing Mpstat
Mpstat comes with the sysstat package. To install it, open the terminal. On Debian or Ubuntu, type sudo apt-get install sysstat. For CentOS or Red Hat, use sudo yum install sysstat. On Fedora, try sudo dnf install sysstat. After installation, enable the sysstat service to collect data. Use sudo systemctl enable sysstat and sudo systemctl start sysstat. Now, Mpstat is ready to use.
Reading Mpstat Output
Run mpstat in the terminal for CPU stats. It shows CPU usage in percent. Look at columns like %usr, %sys, and %idle. %usr means CPU time spent on user tasks. %sys is time used by system tasks. %idle shows how much CPU is free. Lower %idle means higher CPU usage. You can add -P ALL to see per-core info. This helps find if one core is overloaded. Use mpstat 2 5 to check stats every 2 seconds, 5 times.
Credit: www.atlantic.net
Analyze Cpu Load With Sar
Analyzing CPU load is key to understanding how your Linux system performs. The sar tool collects and reports system activity data, including CPU usage. It provides detailed insights into CPU load over time.
Using sar, you can track CPU usage patterns and spot performance issues early. This helps you keep your system running smoothly and efficiently.
Setting Up Sar
Most Linux distributions include the sysstat package, which contains the sar tool. Install it using your package manager if it’s not already present.
For example, on Debian or Ubuntu, run sudo apt-get install sysstat. On CentOS or Fedora, use sudo yum install sysstat.
After installation, enable and start the sysstat service to begin data collection. Use commands like sudo systemctl enable sysstat and sudo systemctl start sysstat.
Extracting Cpu Usage Reports
Run sar with the -u option to view CPU usage. For example, sar -u 1 5 reports CPU stats every second for five times.
The output shows user, system, idle, and iowait CPU percentages. These numbers reflect CPU activity and waiting times.
Use sar -u -f /var/log/sysstat/saXX to view past reports, where XX is the day number. This lets you analyze CPU load history.
Combine sar with other options to get more detailed reports, such as per-CPU usage or load averages.
Explore Cpu Usage Via /proc/stat
The /proc/stat file in Linux holds valuable data about CPU usage. It gives a direct look at how your CPU works in real-time. This file updates constantly, showing how much time the CPU spends on different tasks.
Exploring /proc/stat helps you understand CPU load without extra tools. You read raw numbers and calculate usage yourself. This approach suits users who want precise control and learning about system internals.
Accessing Cpu Data File
Open a terminal on your Linux machine. Type cat /proc/stat and press enter. The first line starts with cpu followed by several numbers. These numbers show time spent by the CPU in various modes.
The values are in units called jiffies, representing CPU ticks. Each number means time spent on user tasks, system tasks, idle time, and more. You can see multiple lines for each CPU core if your system has more than one.
Calculating Cpu Utilization Manually
To find CPU usage, record two snapshots of /proc/stat data seconds apart. Calculate differences between the values for each mode. The total difference equals the total time passed.
Subtract the idle time difference from the total time difference. Divide this by the total difference to get CPU usage percentage. This shows how busy the CPU was in that time frame.
Manual calculation helps understand CPU activity without software tools. It also improves your skills in reading Linux system files directly.
Credit: phoenixnap.com
Graphical Tools For Cpu Monitoring
Graphical tools make it easy to watch your CPU use in Linux. They show real-time data on how much your CPU works. This helps you find problems fast and keep your system running well. These tools use simple charts and graphs to explain CPU activity. You do not need to use commands in the terminal.
Two common graphical tools are Gnome System Monitor and KDE System Activity. Both are user-friendly and come pre-installed on many Linux systems. They provide clear views of CPU usage and other system resources.
Using Gnome System Monitor
Gnome System Monitor is popular for its clean and simple interface. Open it from your applications menu. The “Resources” tab shows CPU use in a graph. You can see each CPU core’s activity separately. It updates every second to give current data. You can also check memory and network use here. The tool lets you end tasks that use too much CPU.
Kde System Activity
KDE System Activity is part of the KDE desktop environment. Access it by pressing Ctrl+Esc or from the system menu. It shows CPU use in a detailed graph with different colors. You can watch how processes affect CPU load. The interface lets you sort processes by CPU use. This helps find the biggest resource users fast. It also shows memory and disk use for full system monitoring.
Automate Cpu Monitoring With Scripts
Automating CPU monitoring helps track your Linux system’s performance without manual checks. Scripts can run commands to check CPU usage and save the results. This saves time and alerts you to issues early.
Scripts also allow customizing monitoring for specific needs. They can run at set times or intervals. This way, you get regular updates on CPU health without effort.
Sample Bash Script For Cpu Check
Create a simple Bash script to check CPU usage quickly. Use the top or mpstat command inside the script. Save CPU data to a file for later review.
!/bin/bash Check CPU utilization and save to file DATE=$(date '+%Y-%m-%d %H:%M:%S') CPU_USAGE=$(top -bn1 | grep "Cpu(s)" | awk '{print $2 + $4}') echo "$DATE CPU Usage: $CPU_USAGE%" >> /var/log/cpu_usage.log This script captures the CPU usage percentage and logs it with a timestamp. Adjust the file path to fit your system setup.
Scheduling With Cron Jobs
Use cron jobs to run your CPU monitoring script automatically. Cron schedules tasks at fixed intervals. This keeps your monitoring consistent.
To add a cron job, open the crontab editor with crontab -e. Add a line like this to run the script every 5 minutes:
/5 /path/to/cpu_check.shReplace /path/to/cpu_check.sh with your script’s location. Save and exit to activate the cron job.
Cron will run your script regularly and log CPU data. Check the log file to monitor CPU trends over time.
Tips To Optimize Cpu Usage
Optimizing CPU usage helps your Linux system run smoothly. It saves power and improves performance. You can keep your system fast and responsive by managing CPU use well.
Focus on finding processes that use too much CPU. Then control system resources to avoid slowdowns. These tips will help you keep your CPU balanced and efficient.
Identifying Cpu Hogging Processes
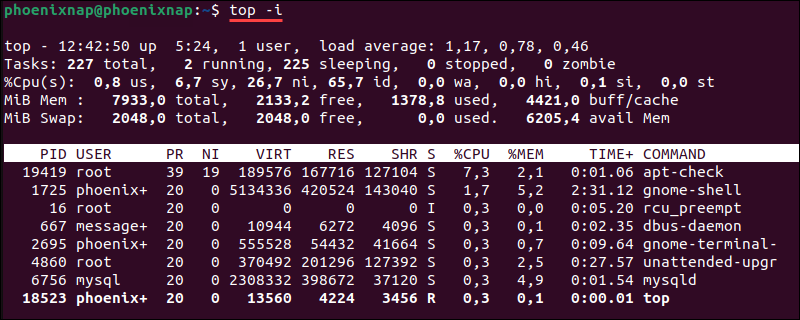
Check which processes use most CPU with the top or htop commands. These tools show real-time CPU use for each process. Spot processes with high CPU percentages quickly.
Use ps aux --sort=-%cpu to list processes by CPU usage. This helps find heavy CPU tasks easily. Kill or restart processes that use too much CPU to free resources.
Managing System Resources
Limit CPU use by setting process priorities with the nice command. Lower priority means less CPU time for less important tasks. Use renice to change priorities of running processes.
Control CPU limits with cpulimit for specific applications. It prevents any program from taking too much CPU. Also, stop unused services to reduce CPU load.
Regularly update your system to improve efficiency. Updates fix bugs and optimize CPU use. Keep your Linux system clean for the best performance.

Credit: www.cyberciti.biz
Frequently Asked Questions
How To Check Cpu Utilization In Linux Terminal?
You can check CPU utilization using commands like top, htop, or mpstat. These tools provide real-time CPU usage details in the terminal, helping you monitor system performance easily.
What Command Shows Detailed Cpu Usage In Linux?
The mpstat command displays detailed CPU usage statistics. It shows CPU load per processor and overall usage, ideal for in-depth performance analysis.
Can I Monitor Cpu Usage With Graphical Tools In Linux?
Yes, tools like gnome-system-monitor or KSysGuard offer graphical interfaces to monitor CPU usage. They provide user-friendly visuals for real-time system resource tracking.
How Often Should I Check Cpu Utilization In Linux?
Regular monitoring depends on system usage. For servers, check CPU every few minutes during peak hours. For desktops, periodic checks suffice to spot performance issues.
Conclusion
Knowing CPU usage helps keep your Linux system healthy. Regular checks show how busy your processor is. Tools like top, vmstat, and mpstat make this easy. Watch for high CPU use—it can slow your computer. Quick checks help find problems fast.
Keep learning these commands to manage your system well. Understanding CPU use saves time and avoids crashes. Stay aware of your system’s health every day. Simple steps lead to better performance and fewer issues.