Are you curious about how much of your computer’s power is being used right now? Knowing your CPU usage in Linux can help you keep your system running smoothly and catch problems before they slow you down.
Whether you’re troubleshooting a slow computer or just want to understand what’s happening under the hood, this guide will show you simple, clear ways to check your CPU usage. By the end, you’ll have the tools you need to take control of your Linux system’s performance.
Ready to see what’s really going on inside your machine? Let’s dive in.
Check Cpu Usage With Top Command
The top command is a popular tool to check CPU usage in Linux. It shows real-time information about the system’s performance. This tool helps you see which processes use the most CPU power. It also updates the data every few seconds. Understanding this command is key to monitoring your Linux system efficiently.
Running Top In Terminal
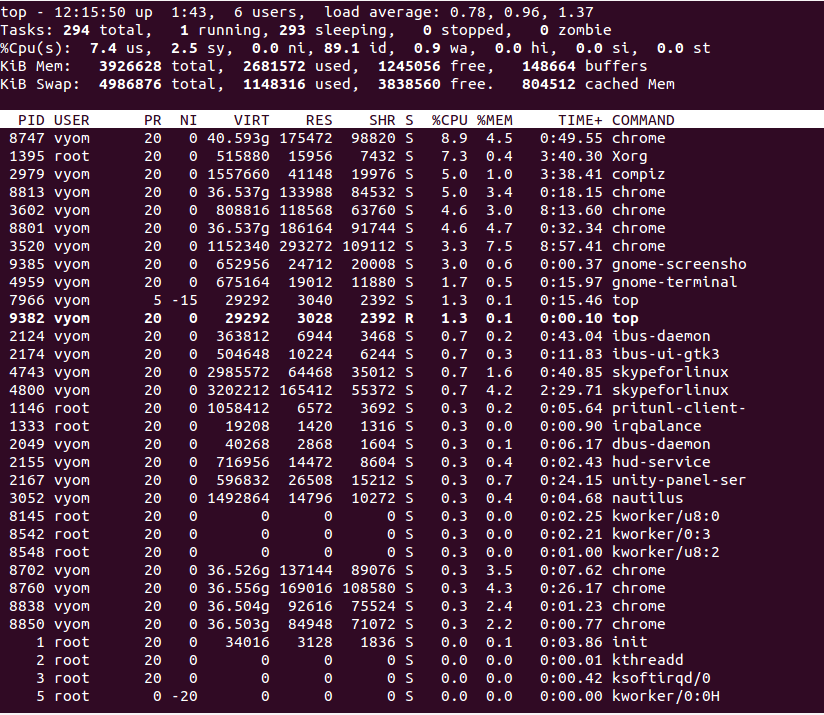
Open your terminal window. Type top and press Enter. The command runs immediately and displays a list of active processes. You will see CPU usage, memory use, and process details. To exit the command, press the q key. This stops the top tool and returns to the command prompt.
Interpreting Cpu Usage Metrics
The top part of the top output shows CPU usage statistics. Look for the line starting with %Cpu(s). It breaks down CPU use into categories. These include user processes, system processes, and idle time. High user or system CPU percentages mean heavy CPU use. A high idle percentage means the CPU is free or not busy. This helps you understand if your system is overloaded.
Using Vmstat For Cpu Monitoring
Monitoring CPU usage is important to keep your Linux system healthy. Vmstat is a simple tool that shows CPU activity in real-time. It helps track how much CPU is used by processes, system, and idle time. This makes it easier to understand system performance and find issues.
Vmstat runs in the terminal and gives a quick overview of CPU and memory stats. It is lightweight and works on almost all Linux versions. You can check CPU usage every few seconds or just once. This flexibility makes vmstat a popular choice for basic CPU monitoring.
Basic Vmstat Usage
Open your terminal to start using vmstat. Just type vmstat and press Enter. You will see a table with several columns and numbers. These numbers update every few seconds by default.
To see continuous updates, add a delay and count. For example, vmstat 2 5 shows stats every 2 seconds for 5 times. This helps watch CPU changes over time without typing the command repeatedly.
Reading Cpu Statistics
Vmstat shows CPU usage in the last columns named us, sy, id, and wa. Each shows a percentage of CPU time.
- us means time spent on user processes.
- sy means time spent on system processes.
- id means idle time when CPU is free.
- wa means time waiting for input/output operations.
Look for high us or sy numbers for heavy CPU use. High id means the CPU is mostly free. High wa might mean slow disk or network tasks.
Employing Mpstat For Detailed Cpu Info
Mpstat is a useful tool for checking CPU usage on Linux systems. It offers detailed and clear information about how your CPU works over time. You can see data about each CPU core and the overall system load. This helps understand system performance and spot problems early.
Using mpstat gives you a deeper look than basic tools. It shows percentages of CPU time spent on tasks like user processes, system processes, and idle time. This detail helps in managing resources and optimizing your system.
Installing Mpstat If Needed
First, check if mpstat is already installed. Open a terminal and type mpstat. If the command is not found, install the package.
On Debian or Ubuntu, use:
sudo apt-get install sysstatFor Red Hat, CentOS, or Fedora, run:
sudo yum install sysstatAfter installation, enable the sysstat service to start data collection.
Using Mpstat To Track Cpu Usage
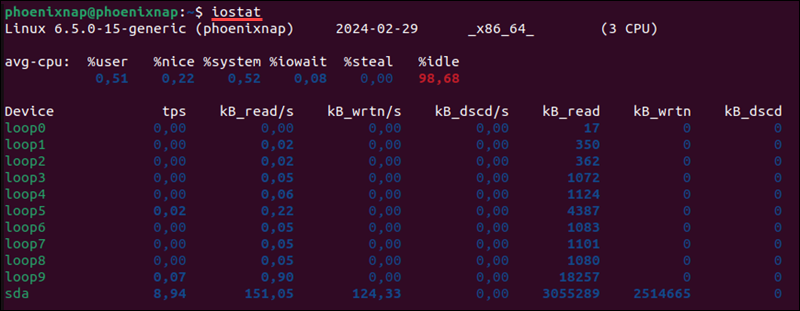
Run mpstat 1 5 to display CPU usage every second for five times. This shows real-time CPU data.
The output includes columns like %usr, %sys, %idle, and more. These numbers show CPU use by user tasks, system tasks, and idle time.
Use mpstat -P ALL 1 5 to see usage for each CPU core. This helps identify if one core is overloaded.
To save the data, redirect output to a file like this:
mpstat 1 5 > cpu_report.txtReview the report to analyze CPU performance over time.
Credit: phoenixnap.com
Getting Cpu Usage Via /proc/stat File
The /proc/stat file in Linux provides key information about CPU usage. It contains raw data that shows how much time the CPU spends on different tasks. This data helps to understand the CPU load on your system.
Reading the /proc/stat file is a simple way to get CPU usage without extra tools. You can use basic commands or scripts to access and analyze this file. This method is useful for quick checks and automation.
Accessing /proc/stat
Open a terminal on your Linux system. Use the cat command to read the file:
cat /proc/statThe first line starts with cpu and shows several numbers. Each number represents time spent by the CPU in different modes like user, system, idle, and others.
Calculating Cpu Usage From Data
To calculate CPU usage, focus on the numbers after the cpu label. These are counters for CPU time in various states. The main states are user, nice, system, idle, iowait, irq, and softirq.
Calculate total CPU time by adding all these values. Then, find idle time from the idle and iowait values. CPU usage is the percentage of time spent not idle.
Take two readings from /proc/stat a few seconds apart. Subtract the earlier values from the later ones. Use these differences to find how busy the CPU was during that time.
Using Ps Command To Check Process Cpu
The ps command is a simple tool to check CPU usage by processes in Linux. It shows active processes and their resource use. You can see how much CPU each process consumes. This helps manage system performance and find heavy tasks.
Using ps gives a snapshot of current CPU usage. It is fast and works in any terminal. This method is useful for quick checks or scripting.
Listing Processes By Cpu Usage
To list processes by CPU use, run ps with sorting options. Use the command:
ps aux --sort=-%cpuThis command shows all processes and sorts them from highest to lowest CPU usage. The aux options display all users’ processes with detailed info. The --sort=-%cpu puts the top CPU users first.
The output includes process ID, CPU percentage, memory use, and command name. This helps spot which processes use the most CPU quickly.
Filtering Specific Processes
You can filter the ps output to see CPU use of specific programs. Combine ps with grep like this:
ps aux | grep process_nameReplace process_name with the name of the program you want to check. This shows only matching processes and their CPU usage.
This method is helpful to track CPU use by a certain application. It avoids clutter from other processes and focuses on what matters.
Graphical Tools For Cpu Monitoring
Graphical tools make CPU monitoring easy for Linux users. They show CPU usage in real-time with clear visuals. These tools help spot problems fast. They are great for users who prefer a visual approach over command lines.
Using Gnome System Monitor
Gnome System Monitor is a popular tool on many Linux systems. It shows CPU, memory, and disk usage clearly. The CPU tab displays usage per core in graphs. You can sort processes by CPU usage to find heavy tasks. It also lets you end tasks that use too much CPU. The interface is simple and user-friendly.
Other Gui Alternatives
KSysGuard is a good choice for KDE desktop users. It offers detailed graphs and process lists. Xfce users can try the Xfce Task Manager. It shows CPU usage with simple graphs. Conky is a lightweight, customizable option for any desktop. It places system info on the desktop itself. These tools suit different desktop environments and needs.
Automating Cpu Usage Checks With Scripts
Automating CPU usage checks with scripts helps monitor your Linux system easily. It saves time by running checks without manual input. Scripts can collect data regularly and alert you about high usage. This approach is useful for servers and personal computers.
Simple scripts are easy to write and customize. Scheduling these scripts makes monitoring seamless. Let’s explore how to create bash scripts and schedule them with cron jobs.
Creating Simple Bash Scripts
Start by opening a text editor like nano or vim. Write a script that uses the top or mpstat command to check CPU usage. For example, use top -b -n1 | grep "Cpu(s)" to get current CPU stats.
Save the script as cpu_check.sh. Make it executable with chmod +x cpu_check.sh. Running this script prints CPU usage to the terminal. You can also add commands to save the output to a file for later review.
Scheduling With Cron Jobs
Cron jobs automate script execution at set times. Open the crontab editor with crontab -e. Add a line to run your script every 10 minutes:
/10 /path/to/cpu_check.shThis command runs the script every 10 minutes. Adjust the timing to fit your needs. Cron logs the execution, so you can check if the script runs properly. This setup keeps CPU monitoring active without manual checks.
Credit: www.atlantic.net

Credit: runcloud.io
Frequently Asked Questions
How Can I Check Cpu Usage In Linux Terminal?
You can check CPU usage using the ‘top’ or ‘htop’ commands in the terminal. These tools display real-time CPU activity and process details efficiently.
What Command Shows Cpu Usage Percentage In Linux?
The ‘mpstat’ command shows CPU usage percentage in Linux. It provides detailed CPU statistics, helping you monitor system performance accurately.
How To Get Cpu Usage Of A Specific Process?
Use the ‘ps’ command with options like ‘ps -p [PID] -o %cpu’ to view CPU usage of a specific process in Linux.
Can I Monitor Cpu Usage Graphically In Linux?
Yes, tools like ‘htop’ and ‘gnome-system-monitor’ offer graphical interfaces to monitor CPU usage visually in Linux systems.
Conclusion
Monitoring CPU usage in Linux helps keep your system healthy. Simple commands show real-time data quickly. You can spot issues before they grow. Checking CPU use saves time and frustration. Try these methods often to stay informed. Understanding your system boosts your control and efficiency.
Keep practicing to get comfortable with the tools. Regular checks make your Linux experience smoother. Easy steps lead to better system management. Stay curious and explore more Linux commands.