
Are you curious about how busy your Linux system’s CPU really is? Knowing your CPU utilization can help you understand if your computer is running smoothly or if something is slowing it down.
You’ll discover simple and effective ways to check CPU usage right from your Linux terminal. Whether you’re a beginner or just want quick tips, this guide will help you take control of your system’s performance. Keep reading—you’ll be surprised how easy it is to get this crucial information!

Credit: www.pwmachineservices.com
Check Cpu Usage With Top Command
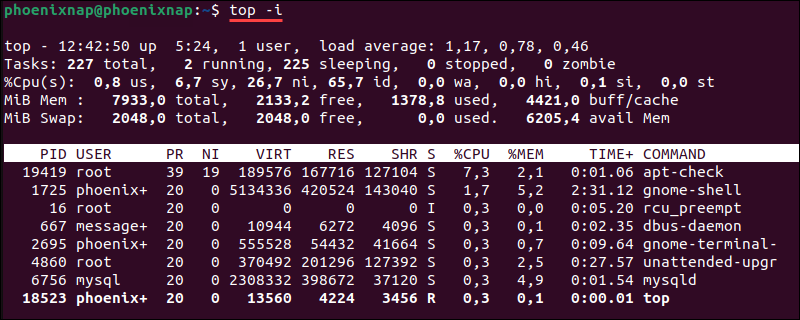
The top command is a simple way to check CPU usage on Linux systems. It shows real-time data about your system’s processes and CPU activity. This tool runs in the terminal and updates continuously, helping you see which programs use the most CPU power.
Using top helps you monitor system health and find performance issues fast. It displays CPU usage along with memory use, process IDs, and more.
Running Top In Terminal
Open your terminal. Type top and press Enter.
The command starts displaying a list of running processes. The screen refreshes every few seconds. You can stop it anytime by pressing q.
Interpreting Cpu Metrics
Look at the line starting with %Cpu(s):. This shows CPU use in percentages.
Idle time is the CPU not doing work. User time is for normal programs. System time is for system tasks.
High user or system time means high CPU load. Idle near 100% means the CPU is mostly free.
Customizing Top Output
Press 1 inside top to see CPU usage per core.
Press Shift + P to sort processes by CPU usage. Press Shift + M to sort by memory use.
Use top -d 2 to change refresh rate to 2 seconds. Customize the display to focus on what matters most.
Use Vmstat For Cpu Statistics
Using vmstat is a simple way to check CPU usage in Linux. This tool shows system performance data, including CPU activity. It helps you see how much CPU is busy or idle. This information is useful for system monitoring and troubleshooting.
vmstat reports on processes, memory, paging, block IO, traps, and CPU activity. You can run it easily in the terminal. It provides a quick snapshot or continuous updates about CPU usage.
Basic Vmstat Command Usage
Open the terminal and type vmstat. The command shows a summary of system stats.
Example:
vmstatThis displays one line of output with CPU and memory data. To see live updates, add a delay in seconds.
Example:
vmstat 2This command updates stats every 2 seconds. Press Ctrl+C to stop.
Analyzing Cpu Columns
The CPU section has four key columns: us, sy, id, and wa.
us: Time spent on user processes.sy: Time spent on system (kernel) processes.id: Time CPU is idle.wa: Time waiting for IO operations.
Low id means CPU is busy. High wa can indicate disk or network delays.
Real-time Monitoring With Vmstat
Use vmstat with a time interval for live CPU data.
Example:
vmstat 1 5This command shows five reports, one per second. It helps observe CPU changes over time.
Real-time data aids in spotting performance issues fast.
Monitor Cpu With Mpstat Tool
Monitoring CPU usage is essential to keep your Linux system running smoothly. The mpstat tool helps track CPU performance over time. It shows detailed CPU statistics for all processors. This tool is lightweight and easy to use, making it perfect for beginners and experts alike.
You can use mpstat to check CPU load, idle time, and other key metrics. It provides a clear view of how your CPU resources are used. This helps in spotting performance issues or bottlenecks quickly.
Installing Mpstat
The mpstat command is part of the sysstat package. To install it, open your terminal and run the following:
sudo apt-get install sysstatFor Red Hat-based systems, use:
sudo yum install sysstatAfter installation, enable the service to collect data continuously:
sudo systemctl enable sysstat sudo systemctl start sysstatCommand Syntax And Options
The basic syntax for mpstat is simple:
mpstat [options] [interval] [count]Here, interval is the seconds between each report. count is how many reports to show.
Common options include:
-P ALL– Displays stats for all CPUs.-u– Shows CPU utilization only.-V– Displays the version ofmpstat.
Reading Mpstat Output
The output shows columns like CPU, %usr, %sys, %idle, and more.
CPU: Identifies the processor or ALL for total.%usr: Time spent running user processes.%sys: Time spent on system (kernel) tasks.%idle: Time CPU is idle.%iowait: Time waiting for I/O operations.
High %idle means your CPU is free. High %usr or %sys means heavy CPU use. Watch the %iowait if disk speed affects CPU.

Credit: www.cyberciti.biz
Utilize Sar For Historical Cpu Data
Tracking CPU usage over time helps understand system performance. The sar tool collects and shows historical CPU data. It gives detailed reports on CPU load, user time, system time, and idle time. Using sar helps find patterns and spot issues early.
Enabling Sar On Linux
First, check if sar is installed. Use sudo apt install sysstat on Debian-based systems. For Red Hat-based systems, use sudo yum install sysstat. After installation, enable data collection. Edit /etc/default/sysstat or /etc/sysconfig/sysstat and set ENABLED="true". Start the sysstat service with sudo systemctl start sysstat. Enable it at boot using sudo systemctl enable sysstat.
Fetching Cpu Utilization Reports
Use sar to display CPU data from past hours or days. Run sar -u for CPU usage summary. Add a time option like sar -u 5 3 to get data every 5 seconds, 3 times. For daily reports, use sar -u -f /var/log/sysstat/saXX, replacing XX with the day number. This shows CPU activity recorded on that day.
Scheduling Sar Data Collection
sar collects data automatically through cron jobs. Check the cron file at /etc/cron.d/sysstat. It runs sar every 10 minutes by default. Modify the cron file to change frequency. This keeps CPU data updated without manual work. Make sure the cron service runs properly to collect data continuously.
Examine /proc/stat File
The /proc/stat file in Linux stores important CPU statistics. It helps you track how much time the CPU spends on different tasks. Reading this file reveals the CPU’s workload and idle time. This data is crucial for understanding system performance.
The file updates constantly, showing real-time CPU usage. It records time in units called jiffies, which are small ticks of the CPU clock. By analyzing these values, you can calculate CPU utilization accurately.
Locating Cpu Usage Info
Open the /proc/stat file with a text editor or command like cat /proc/stat. The first line starts with “cpu” followed by several numbers. These numbers represent time spent in different CPU modes:
- User mode
- Nice mode
- System mode
- Idle
- I/O wait
- IRQ
- SoftIRQ
Focus mostly on user, system, and idle fields to calculate usage.
Calculating Cpu Usage Manually
Note the values of CPU fields at two different times. For example, record the first set of numbers, wait one second, then note the second set.
Calculate the differences for each field. Total time is the sum of all differences. Idle time is the difference in the idle field.
Use this formula to find CPU usage percentage:
CPU Usage = (Total time - Idle time) / Total time 100
This shows how busy the CPU was during the interval.
Automating With Scripts
You can write simple shell scripts to automate this process. Scripts read /proc/stat twice, calculate differences, and print CPU usage.
Use commands like awk or bash arithmetic to parse and compute values. Automating saves time and reduces errors.
Run scripts regularly to monitor CPU load over time.
Graphical Tools For Cpu Monitoring
Graphical tools make it easy to check CPU use on Linux. They show real-time data with clear visuals. You can see how much CPU power your system uses. These tools help spot problems fast without using commands. Here are some popular graphical options for CPU monitoring.
Using Gnome System Monitor
GNOME System Monitor is simple and built into many Linux versions. It shows CPU use in a clear graph. You can watch each core’s activity separately. The tool also displays memory and disk usage. Open it from the system menu or by typing gnome-system-monitor. It updates data every few seconds. Perfect for beginners who want quick info.
Kde System Activity
KDE System Activity offers detailed CPU monitoring in KDE desktops. It displays CPU load for all processors. You see which apps use the most CPU power. It also tracks memory and network use. Open it using Ctrl + Esc or from the menu. The live graphs help track system performance clearly. It fits well with KDE’s clean interface.
Third-party Gui Applications
Many third-party apps provide advanced CPU monitoring. Tools like htop have graphical versions with easy-to-read displays. Apps such as Glances show CPU, memory, and disk stats in one screen. Some support alerts for high CPU use. You can install these apps from your package manager. They work on most Linux desktops and are user-friendly.
Tips To Optimize Cpu Usage
Optimizing CPU usage helps your Linux system run smoothly and fast. It prevents slowdowns and crashes. You save energy and extend hardware life. Small changes can make a big difference in performance. Focus on these simple tips to keep your CPU workload balanced.
Identifying High Cpu Processes
Start by finding which processes use the most CPU. Use the top or htop commands to see active tasks. Look for processes with high CPU percentages. Stop or restart any that seem stuck or unnecessary. This reduces strain on your CPU.
Managing Background Services
Background services run without your notice but can slow your system. List all services using systemctl list-units --type=service. Disable services you do not need with systemctl disable service-name. Keep only essential services active. This frees CPU resources for important tasks.
Using Nice And Renice Commands
The nice command sets a process priority before it starts. Use it to lower the priority of less urgent programs. The renice command changes priority of running processes. Lower priority means less CPU time. This helps critical applications run faster.
Credit: phoenixnap.com
Frequently Asked Questions
What Command Shows Cpu Utilization In Linux?
You can use the top or mpstat command to view CPU utilization in Linux. These tools provide real-time CPU usage statistics. The top command displays processes and CPU load, while mpstat offers detailed CPU usage per core.
How To Check Cpu Usage With The Top Command?
Run top in your terminal to see CPU usage. Look at the %CPU column for each process and the summary line for overall CPU load. Press q to exit the top interface when done.
Can I Monitor Cpu Usage Using Vmstat?
Yes, the vmstat command reports CPU usage along with memory and I/O stats. The CPU columns show idle, user, and system time percentages. It’s useful for quick, periodic CPU monitoring.
Is There A Gui Tool To Check Cpu Usage On Linux?
Yes, tools like GNOME System Monitor or KDE System Guard offer graphical CPU usage views. They provide real-time charts and detailed process information, making monitoring easier for users preferring a GUI.
Conclusion
Monitoring CPU usage helps keep your Linux system healthy. Simple commands show real-time CPU data easily. Regular checks can prevent slowdowns and crashes. Try different tools to find the best fit. Understanding CPU load helps you manage system tasks better.
Keep practicing these steps to improve your skills. Stay aware of your system’s performance daily. This knowledge supports smoother and faster Linux use.