
Are you curious about how much work your Linux system’s brain—the CPU—is handling right now? Knowing your CPU utilization can help you spot slowdowns, improve performance, and avoid system crashes before they happen.
In this guide, you’ll learn simple and effective ways to check your CPU usage on Linux. Whether you’re a beginner or someone looking to sharpen your skills, this article will give you clear, step-by-step methods that you can use right away.
Ready to take control of your system’s performance? Let’s dive in.
Cpu Utilization Basics
Understanding CPU utilization is key to managing your Linux system’s performance. It shows how much work your processor is handling at any moment. By knowing the basics, you can keep your system running smoothly.
What Cpu Utilization Means
CPU utilization is the percentage of time the CPU spends working. It measures how busy the processor is. A low percentage means the CPU is mostly idle. A high percentage shows the CPU is working hard. This number helps you see if your system is overloaded or underused.
Why Monitoring Cpu Matters
Watching CPU use helps find problems early. If the CPU stays very busy for long, your system may slow down. Monitoring lets you spot heavy programs or errors. It also helps plan upgrades. Keeping an eye on CPU use keeps your Linux system healthy and fast.

Credit: runcloud.io
Using Top Command
The top command is a simple tool to check CPU use on Linux. It shows real-time data about the system’s processes and resource use. You can see which tasks use the most CPU and memory. This helps in managing system performance quickly.
Using top requires no extra setup. Just run the command and watch the data update every few seconds. It works in the terminal and gives a live view of your system’s health.
Launching Top
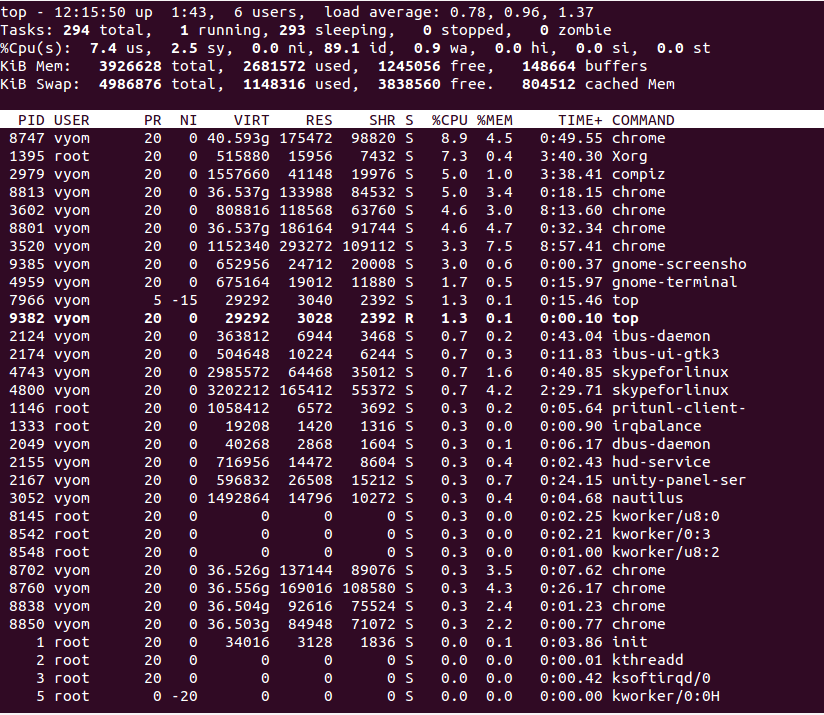
To start top, open your terminal. Type top and press Enter. The screen will fill with information about running processes. The first few lines show system summary like CPU and memory use.
Press q to quit and return to the command line.
Interpreting Output
The top section shows CPU usage as percentages. It splits use into user, system, and idle time. User time is CPU used by programs. System time is CPU used by the OS. Idle means the CPU is free.
Below, you see a list of processes. The %CPU column shows how much CPU each process uses. Sort by %CPU to find the most active tasks quickly.
Customizing Display
You can change what top shows. Press f to enter the field management screen. Here, enable or disable columns. Press the letter next to a field to toggle it.
Press z to add colors for easier reading. Use Shift + P to sort by CPU use. These options help focus on important info.
Using Mpstat Tool
The mpstat tool is a simple way to check CPU usage on Linux systems. It shows detailed statistics about CPU performance. This helps you understand how your system handles tasks and processes.
Using mpstat allows you to monitor CPU load in real-time. It provides information for all CPU cores or a specific one. This tool is useful for system administrators and regular users alike.
Installing Mpstat
mpstat comes from the sysstat package. You need to install this package before using mpstat.
To install it on Debian or Ubuntu, use:
sudo apt-get install sysstatOn Red Hat, CentOS, or Fedora, run:
sudo yum install sysstatAfter installation, enable the service to start collecting data:
sudo systemctl enable sysstat sudo systemctl start sysstatReading Cpu Stats
Run mpstat in the terminal to see CPU stats:
mpstatYou will see CPU usage broken into categories. These include user time, system time, idle time, and more.
The %idle column shows how much CPU is free. A low idle value means the CPU is busy.
Use mpstat -P ALL to view stats for each CPU core separately. This helps find if one core is overloaded.
The tool also supports intervals. For example, mpstat 2 5 shows CPU stats every 2 seconds, five times.
Using Vmstat For Cpu Metrics
Vmstat is a simple tool to check CPU performance on Linux. It shows real-time system statistics, including CPU usage. This tool helps you understand how busy your CPU is and if it handles tasks efficiently.
Using vmstat is quick and does not require extra setup. You can monitor CPU load, system processes, and memory usage in one command. This makes vmstat handy for regular system checks and troubleshooting.
Running Vmstat
Open your terminal to start using vmstat. Type vmstat and press enter. The tool displays a summary of CPU, memory, and process data.
To get continuous updates, use vmstat 2. This command refreshes the stats every 2 seconds. Stop it anytime with Ctrl + C.
You can also specify the number of updates, like vmstat 2 5. It shows data every 2 seconds, five times, then stops.
Analyzing Cpu Data
The CPU section in vmstat shows useful fields: us, sy, id, and wa.
us means time spent on user processes. sy is for system or kernel tasks. id shows idle CPU time. wa is time waiting for I/O operations.
High us or sy values mean heavy CPU use. High id means the CPU is mostly free. High wa suggests slow disk or network access.
Watch these numbers to spot CPU overload or bottlenecks. This helps keep your system running smoothly.
Using Sar For Historical Data
The Sar tool collects and reports CPU usage data over time. It helps track CPU performance trends. This data is useful to find issues or check system health.
Sar saves CPU stats regularly. You can review past usage to spot patterns. This historical view aids in managing Linux systems better.
Enabling Sar
First, install the sysstat package. It includes the Sar tool. Use your package manager like apt or yum.
Next, enable data collection. Edit the sysstat config file. Set “ENABLED=true” to start recording.
Start the sysstat service. It runs in the background. This setup collects CPU stats every few minutes.
Viewing Cpu History
Use the command sar -u to see CPU usage. Add -f with the file name for past data.
Data is stored daily in /var/log/sa/. Each file shows a day’s CPU stats.
Sar displays CPU idle, user, and system time. Use this to find high CPU load periods.
Using Htop For Interactive Monitoring
Htop is a useful tool to check CPU usage on Linux systems. It shows real-time data in a clear, colorful display. This tool helps you see which processes use the most CPU power. It also shows memory and swap usage. Htop is interactive, so you can sort and filter data easily.
Installing Htop
Most Linux versions do not have htop pre-installed. Installing it is simple. Use your package manager to add htop. On Ubuntu or Debian, type sudo apt install htop. For Fedora, use sudo dnf install htop. On Arch Linux, type sudo pacman -S htop. After installation, run htop in the terminal to start it.
Navigating Interface
The htop interface shows CPU bars at the top. Each bar represents a CPU core. Colors indicate different usage levels. Below that, you see memory and swap usage. The main area lists running processes. You can scroll through this list with arrow keys.
Use function keys or commands to sort processes. F6 lets you change sorting columns. F9 allows killing a process if needed. F10 exits htop. The interface updates every few seconds, giving live CPU data.
Checking Cpu Usage With /proc/stat
Checking CPU usage with /proc/stat offers a direct way to monitor system performance. This file contains detailed CPU statistics updated by the kernel. You can access raw data about CPU time spent on different tasks.
Understanding how to read and calculate this data helps track CPU load over time. This method uses simple commands and basic math. It is useful for quick checks or automated scripts.
Accessing /proc/stat
Open a terminal window on your Linux machine. Type cat /proc/stat and press Enter. The first line starts with cpu followed by several numbers. These numbers show time spent by the CPU in various modes.
The fields represent user time, system time, idle time, and more. Each value is measured in units called jiffies. One jiffy equals the smallest time unit the kernel uses.
Calculating Cpu Load
To find CPU load, record the values twice. Take a short pause between readings, like one second. Subtract the earlier values from the later ones to find differences.
Sum all differences except idle time to get active CPU time. Add all differences for total CPU time. Divide active time by total time to get CPU usage percentage.
This calculation shows how busy the CPU was during the interval. It helps identify heavy CPU use or idle periods. You can automate this process with simple scripts for ongoing monitoring.
Automated Cpu Monitoring Scripts
Automated CPU monitoring scripts help track your Linux system’s performance without manual checks. They save time and catch issues early. You can create simple scripts to log CPU usage regularly. Then, schedule them to run automatically. This keeps your system health visible all the time.
Writing Simple Bash Scripts
Start with a basic bash script to check CPU usage. Use the top or mpstat command inside the script. Save the output to a file with a timestamp. This way, you can review the CPU load history. Here is a simple example:
!/bin/bash echo "$(date): $(mpstat 1 1 | grep 'Average')" >> /var/log/cpu_usage.log This script logs the average CPU usage every time it runs. You can modify it to include more details or different commands.
Scheduling With Cron
Cron automates running your bash script at fixed times. Edit the cron jobs using crontab -e. Add a line to run the script every 5 minutes:
/5 /path/to/your_script.sh Cron will execute your script regularly, keeping CPU usage logs updated. Check the log file anytime to see how your CPU performs over time.
Tips For Accurate Cpu Monitoring
Monitoring CPU usage on Linux helps keep your system healthy. Accurate data guides better decisions for performance tuning. Small mistakes can cause wrong readings and confusion. Follow simple tips to get clear and reliable CPU statistics.
Understanding these tips makes CPU monitoring easier. You will save time and avoid common errors. Choose the best method that fits your needs and system setup.
Avoiding Common Pitfalls
Do not rely on a single tool for CPU data. Some tools show average values that hide spikes. Watch out for background processes that affect readings. Run checks multiple times to confirm results. Avoid using CPU monitoring on overloaded systems. It can give false high usage numbers.
Choosing The Right Tool
Pick a tool based on the information you want. For quick checks, use top or htop. For detailed logs, try mpstat or vmstat. Graphical tools like gnome-system-monitor help visualize usage. Command-line tools work well for scripts and automation. Match the tool to your skill level and task needs.

Credit: www.cyberciti.biz
Credit: www.atlantic.net
Frequently Asked Questions
How Do I Check Cpu Utilization On Linux?
Use commands like top, htop, or mpstat to monitor CPU usage in real-time. These tools display detailed CPU stats, including user, system, and idle times.
Which Linux Command Shows Cpu Usage Percentage?
The top command provides a dynamic overview of CPU usage percentage. It updates continuously, showing which processes consume the most CPU resources.
Can I Monitor Cpu Utilization Via Command Line Tools?
Yes, command line tools like vmstat, sar, and mpstat help monitor CPU utilization efficiently on Linux systems.
How To Interpret Cpu Usage In Linux Commands?
CPU usage is divided into user, system, idle, and I/O wait percentages. High user or system values indicate active processing, while high idle means low CPU load.
Conclusion
Checking CPU usage on Linux helps keep your system healthy. It shows which programs use the most resources. You can use simple commands like top, htop, or mpstat. These tools give real-time data quickly and easily. Regular checks prevent slowdowns and crashes.
Knowing CPU utilization helps you manage tasks better. Keep practicing these steps to improve your skills. Your Linux system will run smoother and faster. Simple monitoring makes a big difference in performance. Give it a try and see the benefits yourself.