
Are you wondering how busy your Linux system really is? Knowing your CPU utilization can help you spot performance issues before they slow you down.
You’ll learn simple and effective ways to check your CPU usage right from the command line. Whether you’re a beginner or want a quick refresher, these easy steps will give you clear insights into what’s happening inside your machine. Keep reading, and you’ll be able to monitor your system like a pro in no time.
Cpu Utilization Basics
Understanding CPU utilization is key for managing a Linux system effectively. It shows how much work your processor does over time. This helps in keeping your system running smoothly and spotting problems early.
CPU utilization basics cover what the term means and why it matters for your system’s health. Grasping these concepts helps you use tools to check your CPU’s activity properly.
What Cpu Utilization Means
CPU utilization measures the percentage of time your CPU spends doing work. It shows how busy the processor is at any moment. A high percentage means the CPU is working hard. A low percentage means it is mostly idle. Understanding this helps you know if your system handles tasks efficiently.
Why Monitoring Cpu Matters
Monitoring CPU usage helps avoid system slowdowns. It identifies when a program uses too much processing power. This can cause your system to lag or freeze. Tracking CPU use also helps find hardware problems early. It ensures your Linux system runs fast and stable.
Using Top Command
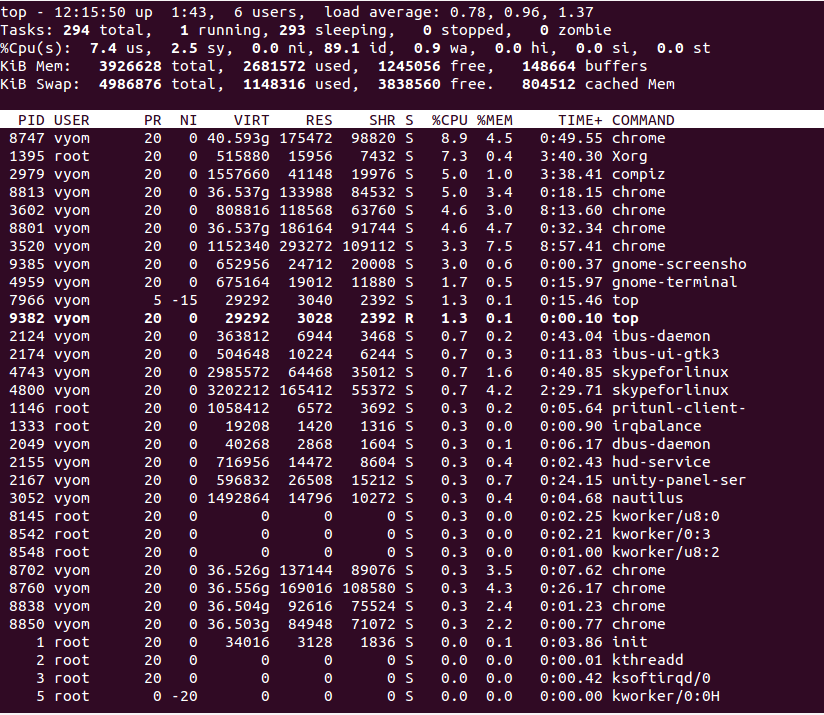
The top command is a common tool to check CPU usage in Linux. It shows real-time information about system processes and resource use. You can see which programs use the most CPU and memory. This helps to understand system performance and find issues quickly.
The top display updates every few seconds. It gives a live view of what is happening on your computer. You can also sort and filter data to focus on specific tasks.
Launching Top
Open a terminal window on your Linux system. Type top and press Enter. The command runs immediately and shows the current system stats.
To exit top, press the q key. This will return you to the command prompt.
Interpreting Output
The first lines show summary information. You see CPU load, number of tasks, memory use, and system uptime.
Below the summary, the list of processes appears. Each row shows one process with details like PID, user, CPU%, and memory%.
Look at the %CPU column to find processes using the most CPU. High values mean heavy usage.
Filtering Processes
Press the o key to filter processes in top. You can enter conditions to show specific tasks.
For example, type COMMAND=firefox to see only Firefox processes. This helps to focus on relevant data.
Use the u key to filter by user. Enter a username to view only that user’s processes.
Checking Cpu With Mpstat
Checking CPU utilization helps you understand your Linux system’s performance. Mpstat is a useful tool for this task. It shows how much your CPU is busy or idle. This helps you spot problems or slowdowns. Mpstat displays detailed stats for each CPU core. This makes it easier to find which part of the CPU needs attention.
Installing Mpstat
Most Linux systems do not have Mpstat installed by default. It is part of the sysstat package. Use your package manager to install it. For Ubuntu or Debian, run sudo apt-get install sysstat. For CentOS or Red Hat, use sudo yum install sysstat. After installation, enable the sysstat service to collect data. Use sudo systemctl enable sysstat and sudo systemctl start sysstat.
Running Mpstat Commands
Open your terminal to run Mpstat commands. Type mpstat to see CPU stats since boot. Add a number after it to update every few seconds. For example, mpstat 2 updates stats every two seconds. Use mpstat -P ALL to see stats for all CPU cores. Combine options like mpstat -P ALL 2 for detailed real-time info.
Analyzing Results
Look at the %usr column for user CPU usage. It shows time spent on applications. The %sys column shows CPU time used by the system. %idle shows how much CPU is free. A low %idle means the CPU is busy. High %iowait means the CPU is waiting for disk or network. Check all cores to find uneven usage. This helps identify CPU bottlenecks easily.

Credit: runcloud.io
Viewing Cpu Usage Via Vmstat
Viewing CPU usage via vmstat helps you understand how your Linux system uses its processor. This command shows real-time data about system processes, memory, and CPU activity. It is simple to use and gives clear numbers that reflect system performance.
You can run vmstat in the terminal to get a snapshot of CPU usage. This tool is handy for quick checks or continuous monitoring. Understanding its output helps you spot performance issues early.
Using Vmstat Basics
Open the terminal and type vmstat 1 5. This runs the command every second for five times. The first line shows averages since the system started. The following lines show current data.
The output has columns with short labels. Each column gives information about different parts of system activity. Focus on CPU-related columns for checking processor use.
Key Metrics To Watch
Look at the columns us, sy, id, and wa. us shows CPU time for user processes. sy shows CPU time for system processes. id shows idle CPU time. wa shows time waiting for input/output.
High us and sy mean the CPU works hard. High id means the CPU is mostly idle. High wa can indicate slow disk or network.
Using Sar For Detailed Reports
Using Sar for detailed CPU reports gives you deep insights. It collects and shows CPU usage over time. This helps track system performance and detect problems early. Sar provides more data than simple commands, making it useful for thorough analysis.
Setting Up Sar
First, install the sysstat package. It includes the sar tool. Use your Linux package manager to install it, like apt or yum. After installation, enable the sysstat service to start collecting data. This runs in the background and logs CPU usage regularly.
Generating Cpu Reports
Run the sar command to see CPU usage. Use options like -u to show CPU utilization. You can specify a time interval and count to get repeated samples. For example, sar -u 5 3 shows CPU stats every 5 seconds, three times. Reports include user, system, and idle CPU percentages.
Scheduling Regular Monitoring
Set up a cron job to run sar automatically. This creates continuous CPU usage logs. Edit the cron file with crontab -e. Add a line to run sar at your chosen frequency. This way, you get ongoing data without manual checks. Review logs later for trends and spikes.
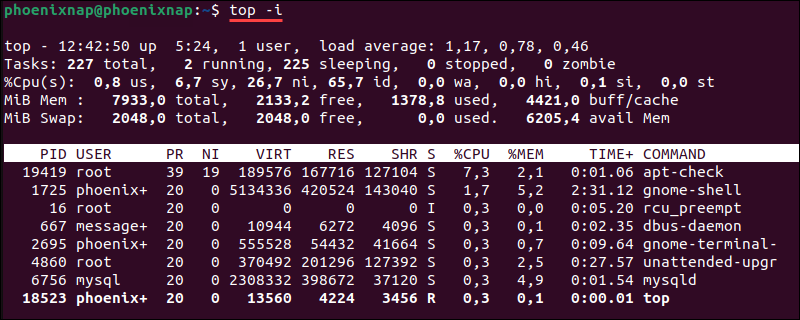
Credit: phoenixnap.com
Graphical Tools For Cpu Monitoring
Graphical tools provide an easy way to monitor CPU usage on Linux. They show real-time data in visual formats. This helps users quickly understand how the CPU is performing. These tools are user-friendly and do not require command-line skills. They suit beginners and those who prefer visual data over text.
Using Gnome System Monitor
Gnome System Monitor is a popular tool on many Linux systems. It shows CPU usage in a clear graph and numeric form. Users can open it from the applications menu. The “Resources” tab displays CPU, memory, and network usage. The CPU graph updates every second. This helps spot any spikes or heavy usage quickly. You can also see which processes use the most CPU.
Exploring Ksysguard
KSysGuard is another graphical tool found on KDE desktops. It offers detailed CPU monitoring and other system stats. The interface is simple and shows CPU load in graphs. Users can customize the display to focus on specific CPUs or cores. KSysGuard also lists running processes with CPU consumption details. It updates in real time and helps track system performance easily.
Interpreting Cpu Data
Understanding CPU data is key to managing your Linux system well. It shows how much work your processor is doing. This helps find problems early and keep your system fast.
CPU data includes numbers that show usage in percentages. These numbers tell how busy your CPU is. Reading this data right helps you know when the system is slow or overloaded.
Identifying High Cpu Usage
High CPU usage means your processor is working hard. This can slow down your system. Check the CPU percentage in tools like top or htop. Numbers above 80% often show high usage.
Look for processes using the most CPU. They appear at the top of the list. Spotting these helps you know which program causes the load.
Common Causes And Fixes
Some programs use too much CPU by mistake. A stuck process or bug can cause this. Restarting the program or the system may help. Sometimes, updating software fixes these issues.
Heavy tasks like video editing or gaming also raise CPU use. Plan these tasks during low activity times. Closing unused programs frees CPU power. Monitoring helps keep your Linux system running smoothly.
Credit: www.atlantic.net
Automating Cpu Checks
Automating CPU checks saves time and helps catch issues early. Manual checks can be slow and easy to forget. By using simple scripts and scheduling tools, you can monitor CPU use regularly without effort. This keeps your Linux system running smoothly.
Writing Simple Scripts
Create a basic script to check CPU use quickly. Use commands like top or mpstat inside the script. Save the output to a file for review later. For example, a script can run mpstat 1 1 and log the results. This script runs fast and uses little system power.
Using Cron Jobs
Cron lets you run scripts automatically at set times. Add your CPU check script to the cron schedule. For example, run the script every 10 minutes to track CPU load. Cron sends output to your email or log files for easy access. This keeps CPU monitoring regular and hands-free.
Frequently Asked Questions
What Command Shows Cpu Usage In Linux?
The top command displays real-time CPU usage and processes. It updates continuously, showing CPU percentage and system load.
How To Check Cpu Utilization Using Terminal?
Use mpstat or vmstat commands in terminal. They provide detailed CPU stats including user, system, and idle time.
Can I Monitor Cpu Load With Graphical Tools?
Yes, tools like htop and gnome-system-monitor show CPU load graphically. They offer user-friendly interfaces for real-time monitoring.
What Is The Best Way To Log Cpu Usage Over Time?
Use sar command from sysstat package. It collects and logs CPU usage data at set intervals for analysis.
Conclusion
Checking CPU usage in Linux helps keep your system healthy. Use simple commands like top, vmstat, or mpstat to see real-time data. Monitoring CPU helps find problems early. It also improves your computer’s speed and performance. Practice these steps regularly to stay in control.
Knowing how to check CPU makes managing Linux easier. Start checking today and keep your system running smoothly.