
Are you wondering how to check your CPU usage on Linux quickly and easily? Knowing how much of your processor’s power is being used can help you spot problems before they slow down your system.
Whether you’re a beginner or just need a clear, straightforward guide, this article will show you simple ways to monitor your CPU in real time. Keep reading, and you’ll learn the best tools and commands to keep your Linux machine running smoothly.

Credit: runcloud.io
Monitor Cpu With Top Command
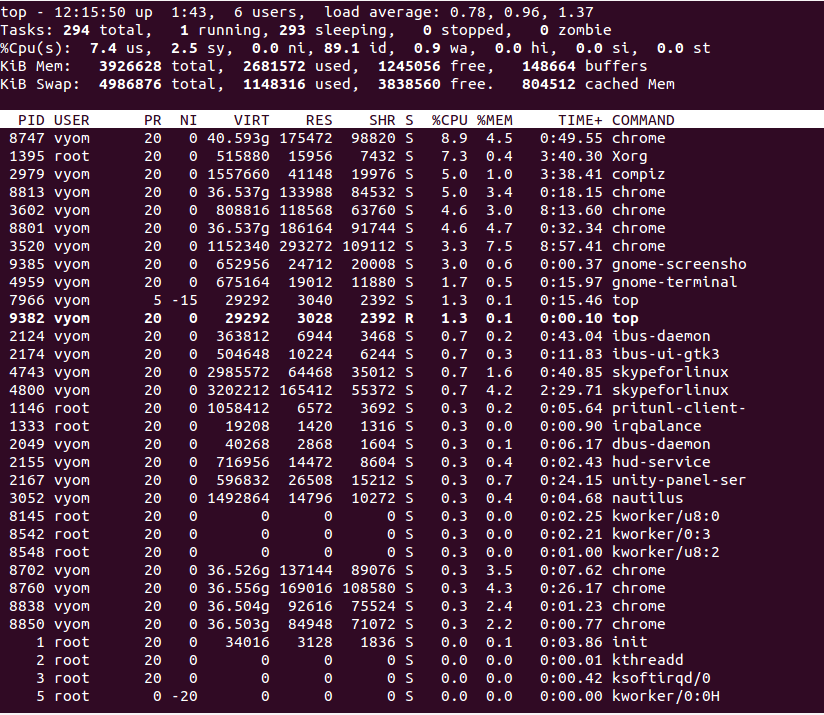
The top command is a popular tool to monitor CPU usage on Linux systems. It shows real-time information about running processes and system resources. Using top, you can quickly see how much CPU is used and which processes consume the most power.
This tool is easy to run from the terminal and provides a live view. It helps you spot issues with high CPU usage fast. Below, we explain how to use top effectively.
Basic Usage Of Top
Open your terminal and type top, then press Enter. The command starts and updates the screen every few seconds.
You will see a list of processes with details like CPU and memory use. The top lines show system summary, including CPU usage and load average.
To exit top, press the q key.
Interpreting Cpu Metrics
The CPU section in top shows percentages for different states. Look for %us (user processes) and %sy (system processes).
High %id means CPU is mostly idle, which is good. Low idle time means heavy CPU use.
Check %wa for I/O wait time. A high value means CPU waits for disk or network.
Customizing Top Display
You can change top view to focus on what matters to you. Press f to enter fields management.
Use arrow keys to select fields, and press d or space to toggle them.
Press W to save your settings for next time. You can also change refresh rate by pressing d and entering seconds.
Check Cpu Usage Using Htop
Checking CPU usage is essential for managing system performance. Htop is a popular tool for this task on Linux. It shows real-time CPU usage and other system resources in a user-friendly way. Htop helps you see which processes use the most CPU power. This makes it easier to monitor and troubleshoot your system.
Installing Htop
Most Linux distributions do not have Htop installed by default. You can easily install it using your package manager. On Ubuntu or Debian, run sudo apt install htop. For Fedora, use sudo dnf install htop. On Arch Linux, type sudo pacman -S htop. After installation, you can launch it by typing htop in the terminal.
Navigating The Htop Interface
Htop’s interface is colorful and easy to read. The top section shows CPU, memory, and swap usage bars. Below, it lists all running processes with details. You can sort processes by CPU, memory, or time. Use the arrow keys to move up and down the list. Press F10 to exit Htop anytime.
Using Htop For Real-time Monitoring
Htop updates the display every few seconds. Watch the CPU bars to see usage changes live. High CPU use means your system is busy. You can also kill processes directly in Htop. Select a process and press F9 to end it. This helps free up CPU resources quickly and easily.
Using Mpstat For Detailed Cpu Stats
Using mpstat offers a clear and detailed view of CPU performance on Linux. This tool breaks down CPU usage into different categories. You can see how much time your CPU spends idle, working, or waiting for input/output. It also shows the usage per CPU core, which is very helpful for multi-core systems.
This detailed data helps you understand your system’s load better. You can spot if one core is overloaded or if the CPU is mostly idle. This insight is key for troubleshooting and optimizing your Linux machine.
Installing Sysstat Package
First, install the sysstat package. It includes the mpstat tool. Open your terminal. Run this command for Debian-based systems:
sudo apt-get install sysstatFor Red Hat-based systems, use this:
sudo yum install sysstatAfter installation, enable the service to start collecting data:
sudo systemctl enable sysstatThen, start the service with:
sudo systemctl start sysstatRunning Mpstat Commands
To see overall CPU usage, type:
mpstatThis command shows average CPU stats since boot. Add an interval to get live updates:
mpstat 2 5This runs mpstat every 2 seconds, 5 times. You get real-time data snapshots. Use mpstat -P ALL to check all CPU cores at once.
Analyzing Cpu Core Usage
The output lists each CPU core separately. Look for the %idle column. It shows how much time the CPU core is free. Lower idle means higher usage.
The %usr column shows user process usage. The %sys shows system process usage. The %iowait shows waiting for disk or network input/output.
Spotting a core with low idle and high %usr or %sys might mean heavy load. This helps you decide if you should balance tasks or upgrade hardware.

Credit: www.cyberciti.biz
View Cpu Usage With Vmstat
Checking CPU usage on Linux helps you understand your system’s performance. vmstat is a simple tool that shows CPU activity along with memory and system processes. It gives a quick snapshot and continuous updates about CPU use. This makes it easy to spot problems or high CPU demand.
Basic Vmstat Commands
To see CPU stats once, type vmstat in the terminal. It shows a summary of CPU and memory use since the last reboot. For live updates, use vmstat 2. This refreshes the data every 2 seconds. To stop, press Ctrl + C. You can change the number for longer or shorter intervals.
Understanding Vmstat Output
The vmstat output has many columns. Focus on the CPU part at the right. It shows us for user processes, sy for system processes, and id for idle time. High us or sy means the CPU is busy. High id means the CPU is mostly idle and free.
Monitoring Cpu Over Time
Use vmstat 5 10 to watch CPU every 5 seconds for 10 times. This shows trends, like rising CPU use or spikes. It helps find patterns or times when the CPU is heavily used. Save the output to a file for later study with vmstat 5 10 > output.txt.
Check Cpu Load From /proc/stat
Checking CPU load on Linux helps monitor system performance. The /proc/stat file holds valuable CPU statistics. It updates in real-time, reflecting system activity.
Reading /proc/stat directly shows CPU time spent on tasks. This method gives a clear view of CPU load. It works without extra tools, using built-in system data.
Accessing /proc/stat File
Open a terminal on your Linux system. Type cat /proc/stat and press Enter. This displays CPU statistics and other system info.
The first line starts with cpu. It shows total CPU time in various modes. These modes include user, system, idle, and others.
Calculating Cpu Usage Manually
Note down the numbers from the cpu line. Wait a few seconds and check again. Calculate differences between the two readings.
Sum all differences to get total CPU time. Subtract idle time difference to find active CPU time. Divide active time by total time. Multiply by 100 for percentage use.
Automating Cpu Usage Calculation
Create a simple script to read /proc/stat twice. Calculate the CPU load automatically. Use shell or Python for easy scripting.
Run the script regularly to monitor CPU load over time. This saves manual calculations and tracks system health efficiently.
Credit: www.atlantic.net
Using Glances For Comprehensive Monitoring
Using Glances for comprehensive monitoring gives a clear view of your CPU usage. This tool shows detailed system information in one place. It works in real-time, making it easier to track performance. Glances helps spot problems before they become serious. It also monitors memory, disk, network, and processes alongside CPU data.
Installing Glances
To install Glances on Linux, open your terminal. Use the command sudo apt-get install glances for Debian-based systems. For Red Hat-based systems, run sudo yum install glances. You can also install it with Python’s package manager using pip install glances. After installation, type glances to start the tool.
Real-time Cpu Monitoring Features
Glances shows CPU usage as a percentage in real-time. It displays each core’s load separately. You can see system load averages and CPU temperature if supported. The interface updates every few seconds automatically. It highlights high CPU use with color codes for easy spotting. You can also monitor running processes and their CPU consumption.
Integrating Glances With Web Interface
Glances offers a web interface for remote monitoring. Start it by running glances -w in your terminal. This command launches a web server on your machine. Open a browser and enter http://localhost:61208 to view the dashboard. The web view shows the same real-time data as the terminal. This feature is useful for monitoring servers remotely and sharing data with others.
Graphical Tools For Cpu Usage
Graphical tools make checking CPU usage on Linux easy and clear. They show real-time data in a visual format. Users can see CPU performance without using command lines. These tools help track system health and find problems fast.
Using Gnome System Monitor
GNOME System Monitor is simple and user-friendly. It shows CPU usage as a graph and percentage. You can see each core’s activity separately. It also displays memory and network use. The tool updates data every few seconds for accuracy. It works well on Ubuntu and other GNOME-based systems.
Kde System Monitor Features
KDE System Monitor offers detailed CPU usage views. It supports multiple graphs and widgets. Users can customize the layout to fit their needs. It shows processes and their CPU consumption clearly. The tool runs smoothly on KDE desktops like Kubuntu. It also tracks disk and memory use alongside CPU data.
Other Gui-based Tools
Several other graphical tools monitor CPU usage on Linux. Tools like Xfce Task Manager and Mate System Monitor provide basic CPU stats. Applications such as Conky offer highly customizable desktop widgets. These tools suit different desktop environments and user preferences. They help users watch CPU activity without complex commands.
Automate Cpu Usage Checks
Automating CPU usage checks helps keep your Linux system running smoothly. It saves time and alerts you to potential problems early. Automation lets you focus on other tasks while your system monitors itself.
Writing Simple Shell Scripts
Create a basic shell script to check CPU usage quickly. Use the top or mpstat command to get CPU stats. Save the output in a log file for review. Scripts can run commands and process results automatically.
Example script:
!/bin/bash cpu_usage=$(mpstat 1 1 | awk '/Average/ {print 100 - $NF}') echo "CPU Usage: $cpu_usage%" >> /var/log/cpu_usage.log Scheduling With Cron Jobs
Cron jobs run your script at set times without manual input. Edit the crontab file with crontab -e. Schedule checks every minute, hour, or day depending on needs. Cron automates regular monitoring effortlessly.
Example cron entry to run every 5 minutes:
/5 /path/to/cpu_check.sh Sending Alerts Based On Cpu Thresholds
Set alerts to notify you if CPU usage is too high. Modify your script to compare usage with a set limit. Use email or messaging tools to send alerts automatically. Alerts help catch issues before they cause harm.
Example alert in script:
threshold=80 if (( $(echo "$cpu_usage > $threshold" | bc -l) )); then echo "High CPU usage: $cpu_usage%" | mail -s "CPU Alert" user@example.com fi Frequently Asked Questions
How Do I Check Cpu Usage On Linux Terminal?
Use commands like top, htop, or mpstat to monitor CPU usage in real time. These tools provide detailed CPU metrics and process information.
What Is The Best Tool To Monitor Linux Cpu Usage?
Htop is the most user-friendly tool for monitoring CPU usage. It offers a colorful, interactive display and more details than the basic top command.
Can I Check Cpu Usage For A Specific Process?
Yes, use top or ps with process ID to check CPU usage for a specific process. These commands show CPU consumption per process.
How To View Cpu Usage History On Linux?
Install and use sar from the sysstat package to view CPU usage history. It collects and reports system activity over time.
Conclusion
Checking CPU usage on Linux helps keep your system healthy. You can use simple commands like top, htop, or mpstat. These tools show real-time CPU activity and help find any issues fast. Regular monitoring avoids slowdowns and crashes. Try these commands often to understand your system better.
Managing CPU usage becomes easier with practice. Keep your Linux running smoothly by watching CPU use regularly.