
Are you curious about how your Linux system’s CPU is performing right now? Knowing your CPU status can help you spot issues early, improve your computer’s speed, and keep everything running smoothly.
Whether you’re a beginner or have some experience with Linux, this guide will show you simple and effective ways to check your CPU status. By the end, you’ll feel confident in monitoring your system’s health and making smarter decisions to boost its performance.
Keep reading to discover easy steps that anyone can follow!
Check Cpu Usage With Top Command
Checking CPU usage is important to understand how your Linux system performs. The top command shows real-time CPU activity and other system information. It runs in the terminal and updates the data every few seconds. This makes it a useful tool for tracking CPU load and spotting issues quickly.
Running Top For Real-time Monitoring
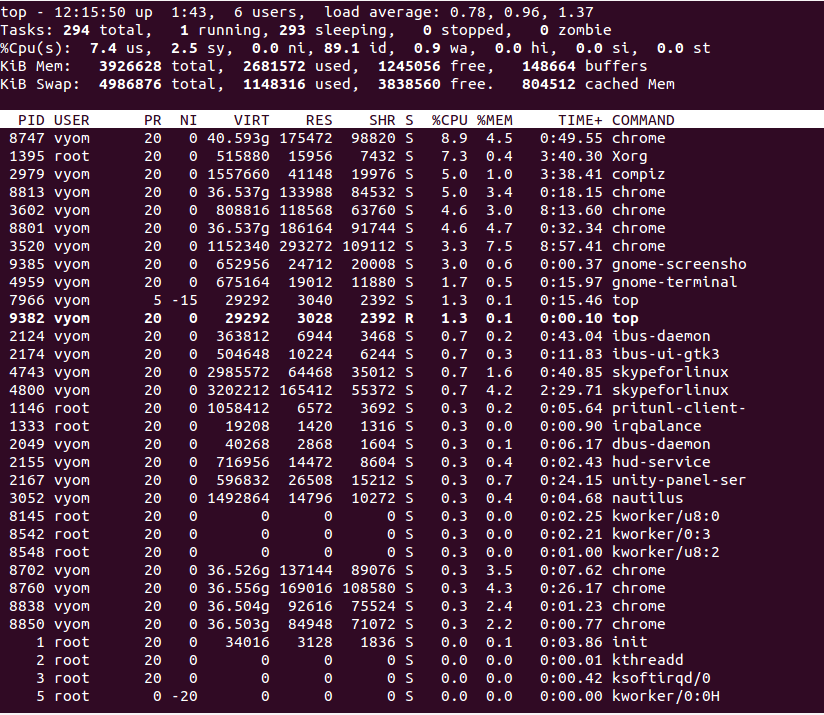
Open a terminal window on your Linux machine. Type top and press Enter. The screen fills with live system data. The display refreshes automatically, showing current CPU usage and running processes. To stop, press the q key. This simple command gives instant insight into your system’s workload.
Interpreting Cpu Metrics In Top
Look at the top part of the top output. You will see several CPU-related numbers. The key ones include user CPU time (us), system CPU time (sy), and idle CPU time (id). User time shows CPU used by applications. System time is CPU used by the system itself. Idle time means the CPU is free. High user or system time may mean heavy CPU load. High idle time means the CPU is mostly free.

Credit: www.cyberciti.biz
Using Mpstat For Detailed Cpu Stats
Using mpstat gives detailed CPU statistics on Linux systems. It shows how much CPU time is spent on tasks like user processes, system processes, and idle time. This tool helps you monitor each CPU core separately.
You can track CPU usage over time, making it easier to spot problems or unusual activity. The output is simple to read, even for beginners. Let’s look at how to install and use mpstat effectively.
Installing Mpstat Tool
The mpstat command is part of the sysstat package. Install it using your package manager.
On Debian or Ubuntu, run:
sudo apt-get install sysstatOn Red Hat, CentOS, or Fedora, use:
sudo yum install sysstatAfter installation, enable the service to collect system data:
sudo systemctl enable sysstatStart the service with:
sudo systemctl start sysstatReading Mpstat Output
Run mpstat with a time interval to see CPU stats continuously:
mpstat 2 5This shows CPU usage every 2 seconds, 5 times.
The columns include:
- %usr: Time spent on user processes.
- %sys: Time spent on system processes.
- %idle: Time CPU is idle.
- %iowait: Time waiting for I/O operations.
Look for high values in %usr or %sys. High %idle means CPU is free.
mpstat -P ALL shows stats for all CPU cores separately. This helps find which core is busy.
Viewing Cpu Info With Lscpu
The lscpu command is a simple way to see CPU details on Linux. It shows clear and useful information about the processor. No complex setup is needed. Just run the command, and the CPU data appears in seconds.
This tool helps understand the CPU’s core features and layout. You get a clear picture of the processor’s design and abilities. Perfect for quick checks or deeper analysis.
Basic Cpu Architecture Details
The lscpu output starts with basic architecture facts. It shows the CPU model name and vendor. You see the number of CPU cores and threads here.
It also lists the CPU family and model number. The architecture type, like x86_64 or ARM, is displayed. This helps identify the CPU generation and type.
CPU speed is shown as the maximum and minimum MHz. The cache size for L1, L2, and L3 appears too. This data is useful to compare CPU power and design.
Advanced Cpu Features
The command lists CPU flags that show advanced features. Flags include support for virtualization, security, and instruction sets. For example, SSE or AVX instructions appear here.
You also get details about CPU socket and NUMA nodes. This is important for multi-processor systems. Hyperthreading support is shown, helping to understand CPU efficiency.
With lscpu, you can check if your CPU supports hardware virtualization. This is key for running virtual machines smoothly.
Monitoring Cpu Load With Uptime
Monitoring CPU load is important to keep your Linux system running smoothly. The uptime command provides a quick look at how busy your CPU has been over time. It shows the load averages for the last 1, 5, and 15 minutes. This helps you understand if your system is under heavy stress or running fine.
Understanding Load Averages
Load averages are numbers that show CPU demand. They tell how many processes are waiting to use the CPU. A load average of 1 means one process is using or waiting for the CPU. If your system has multiple cores, a load average equal to the number of cores means full usage. For example, on a 4-core system, a load average of 4 is normal and balanced.
Higher numbers mean more demand than the CPU can handle. The three numbers show short-term and longer-term loads. The first is the last minute, the second is five minutes, and the third is fifteen minutes. Watching these helps track if the CPU load is rising or falling.
When To Worry About High Load
High load averages can slow down your system. If the load is much higher than your CPU cores, it means the CPU is overloaded. For example, a load of 10 on a 4-core machine is a problem. This can cause delays and make tasks slow. You should check which processes cause high load. Use commands like top or htop to find them.
Sometimes, high load is normal, like during backups or updates. But if it stays high for long, it needs attention. Fixing high load improves system speed and user experience.
Checking Cpu Temperature
Checking your CPU temperature is important to keep your Linux system safe. High temperatures can cause slowdowns or damage. Monitoring helps you act before problems start. This guide shows how to check CPU temperature easily.
Using Lm-sensors Tool
The lm-sensors tool reads temperature sensors on your CPU. First, install it using your package manager. For example, use sudo apt install lm-sensors on Debian or Ubuntu. Next, run sudo sensors-detect to find available sensors. Follow the prompts and answer “yes” to detect all sensors. After that, run sensors to see temperature readings. You will get current CPU temperatures and other sensor data.
Interpreting Temperature Readings
Temperature readings show in degrees Celsius. Normal CPU temperatures range from 30°C to 60°C. Values above 70°C may cause problems. If temperatures reach 90°C or more, your CPU risks damage. Watch for sudden spikes or constant high readings. Keep your system cool with good ventilation or fans. Regular checks help avoid overheating and maintain performance.
Analyzing Cpu Performance With Sar
Analyzing CPU performance is vital for keeping a Linux system healthy and efficient. The sar command, part of the sysstat package, helps track CPU usage over time. It collects data on CPU load, idle time, and other key metrics. This tool reveals patterns and pinpoints problems fast.
Using sar provides detailed reports, making it easier to understand CPU behavior. It runs in the background, logging data regularly. You can check reports anytime to see how your CPU performs during different periods.
Setting Up Sysstat Package
Start by installing the sysstat package on your Linux system. Use your package manager like apt or yum. For example, type sudo apt-get install sysstat on Debian-based systems.
After installation, enable the sysstat service to collect data automatically. Run sudo systemctl enable sysstat and sudo systemctl start sysstat. This activates regular data gathering for CPU and other resources.
Check the configuration file /etc/sysstat/sysstat to adjust data collection frequency if needed. This step ensures that sar gathers enough information for analysis.
Reviewing Cpu Usage Reports
To view CPU status, run the sar -u command. It shows CPU usage, including user, system, and idle times. Each line gives a snapshot at a specific time.
For example, sar -u 1 3 collects data every second for three seconds. This helps monitor real-time CPU activity. You can also check historical data by reading saved log files.
Use sar -u -f /var/log/sysstat/saXX, replacing XX with the day number. This command reviews past CPU usage records. It helps spot trends and unusual spikes in CPU load.
Graphical Tools For Cpu Monitoring
Graphical tools make it easy to check CPU status on Linux. They show CPU usage with clear visuals. This helps users see how much power the CPU uses in real time. These tools are helpful for beginners and advanced users alike.
Using graphical interfaces avoids the need for complex commands. Users can monitor CPU performance with just a few clicks. These tools often display other system info too, like memory and disk usage.
Using Gnome System Monitor
GNOME System Monitor is a popular tool on many Linux systems. It shows CPU usage in a simple graph. Users can see the load of each CPU core separately. The app also displays running processes and memory use.
To open it, search for “System Monitor” in your applications menu. The “Resources” tab gives a real-time CPU graph. You can spot spikes or heavy CPU use easily. It updates every second to keep info fresh.
Other Gui Utilities
Many other graphical tools exist for CPU monitoring. Tools like KDE System Monitor, Mate System Monitor, and Xfce Task Manager work well. They offer similar features with different layouts.
Some tools provide detailed CPU stats and history charts. Others focus on simplicity for quick checks. Choose one that fits your desktop environment and needs.
These utilities help track CPU health and performance. They make system monitoring accessible without command-line skills.

Credit: runcloud.io
Credit: www.atlantic.net
Frequently Asked Questions
How Do I Check Cpu Usage In Linux?
You can check CPU usage using commands like top or htop. These tools display real-time CPU load and processes, helping you monitor performance efficiently.
What Command Shows Cpu Temperature In Linux?
Use the sensors command from the lm-sensors package. It provides detailed CPU temperature readings to help prevent overheating issues.
How To Find Cpu Model And Speed On Linux?
Run lscpu in the terminal. It displays the CPU model, architecture, speed, and other hardware details clearly and quickly.
Can I Monitor Cpu Status Remotely In Linux?
Yes, tools like ssh combined with top or htop allow remote CPU monitoring on Linux servers securely and efficiently.
Conclusion
Checking your CPU status in Linux is simple and useful. You can use commands like top, mpstat, or lscpu to see important details. These tools help you understand how your CPU works and if it needs attention. Regular checks keep your system healthy and fast.
Try these steps today and get to know your Linux CPU better. It’s a small task with big benefits.