
Are you worried that your Linux system might be running slower than it should? Knowing how to check your CPU load is key to understanding your computer’s performance.
When your CPU is overloaded, tasks take longer, programs freeze, and frustration builds up. But don’t worry—this guide will show you simple, clear steps to monitor your CPU load quickly. By the end, you’ll have the tools to keep your Linux system running smoothly and avoid performance headaches.
Keep reading to take control of your CPU like a pro!
Cpu Load Basics
Understanding CPU load is important for anyone using Linux. It shows how busy your computer’s processor is. Knowing the basics helps you keep your system healthy and fast.
CPU load measures the work your processor does over time. It helps spot problems before they slow down your tasks. This guide explains the key points about CPU load.
What Cpu Load Means
CPU load tells you how many tasks the processor handles. It shows the average number of processes waiting to run. A low load means the CPU is free. A high load means the CPU works hard or is overloaded.
For example, a load of 1.0 on a single-core CPU means it is fully busy. On multi-core CPUs, the load is divided across cores. So, a load of 4.0 on a quad-core CPU is full use.
Why Monitor Cpu Load
Monitoring CPU load helps keep your system stable. It shows if your computer is struggling with tasks. High load can cause slow performance or crashes.
By watching CPU load, you can fix issues early. It helps find programs using too much power. You can decide when to close apps or upgrade hardware.
Using Command Line Tools
Checking CPU load in Linux is easy with command line tools. These tools show real-time data about your system’s performance. You can see how busy your CPU is and spot problems early. Using the command line saves time and works on almost all Linux systems.
Top Command
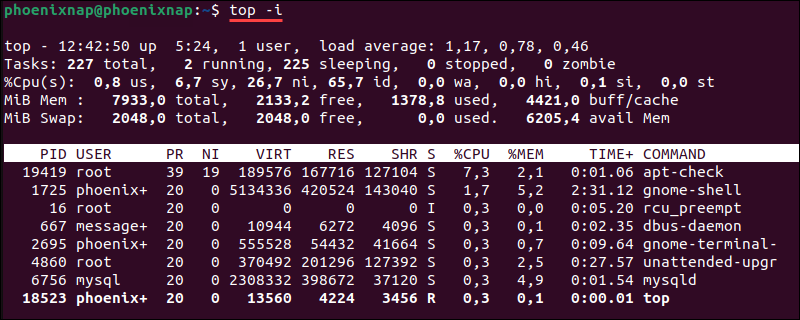
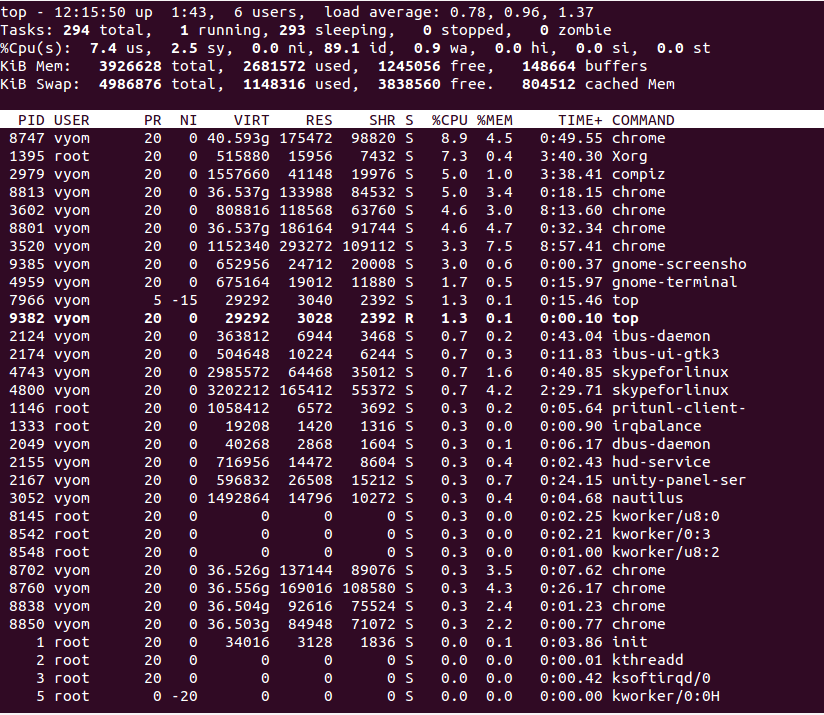
The top command shows running processes and CPU usage. It updates every few seconds. You see which processes use the most CPU. Press q to exit the view. This tool helps find heavy tasks slowing your system.
Uptime Command
The uptime command shows how long the system runs. It also displays the load average. Load average tells the CPU demand over time. You get numbers for 1, 5, and 15 minutes. It’s a quick way to check overall CPU load.
Mpstat Tool
mpstat shows CPU statistics for all processors. It displays usage, idle time, and interrupts. You can track each CPU core separately. Run it with an interval to see live data. This tool is great for multi-core systems.
Vmstat Utility
The vmstat command reports system performance details. It shows CPU, memory, and swap usage. The CPU section highlights user and system time. You can monitor system health with regular checks. Run it with a delay for continuous data.
Graphical Tools For Cpu Load
Graphical tools make checking CPU load on Linux easier and clearer. They show real-time data through visual charts and graphs. This helps users understand system performance without using complex commands. Both built-in and third-party apps offer great options for monitoring CPU usage.
System Monitor Apps
Most Linux distributions include system monitor apps. These tools display CPU load, memory use, and running processes. Users can open them from the main menu or system settings. Popular examples include GNOME System Monitor and KDE System Guard. These apps update data live and provide simple graphs. They help spot high CPU use and troubleshoot performance issues quickly.
Third-party Gui Tools
Third-party graphical tools offer more features and customization. Apps like htop and glances provide colorful, interactive views. They show CPU cores separately and highlight heavy processes. Some tools support alerts when CPU load is too high. Installing these apps is easy via package managers. They enhance the basic system monitors for advanced users and beginners alike.

Credit: www.cyberciti.biz
Interpreting Cpu Load Numbers
Understanding CPU load numbers helps you see how busy your Linux system is. These numbers show how many processes wait to run on the CPU. Knowing how to read them can guide you in managing system performance. It also helps spot problems before they slow down your work.
Load Average Explained
Load average shows the average number of active tasks over time. Linux gives three numbers for load average. These numbers represent the last 1, 5, and 15 minutes. For example, a load average of 1.00 means one task is using or waiting for the CPU.
If your CPU has one core, a load average near 1.00 means full usage. Multiple cores change this. A load average of 4.00 on a 4-core CPU means full usage. Numbers higher than core count show overload. This means tasks wait longer to run.
When To Worry About High Load
High load numbers do not always mean a problem. Look at your CPU core count first. Load higher than the number of cores can slow your system. Watch for consistent high loads, not short spikes. Long high loads may cause slow response or freezes.
Check running programs during high load. Heavy tasks like video encoding or backups can cause it. If no heavy tasks run, high load might mean a problem. It could be a stuck process or hardware issue. Act quickly to avoid system crashes.
Automating Cpu Load Checks
Automating CPU load checks in Linux saves time and prevents system slowdowns. Manual checks can miss sudden spikes that cause problems. Automation keeps track of CPU usage and alerts you quickly. This helps maintain system health and avoid crashes. Simple tools and scripts make automation easy to set up and use.
Setting Up Alerts
Alerts notify you when CPU load is too high. Use tools like cron and mail to send warnings. Set a threshold for CPU load, such as 80% usage. When load passes this, the system sends an alert email. This helps you act fast before issues grow.
Many Linux distributions support alert scripts. You can customize alerts for different load levels. Alerts can also log events for later review. This keeps you informed without constant manual checks.
Using Scripts For Monitoring
Scripting automates CPU load checks efficiently. Bash scripts can read CPU usage from /proc/loadavg. Run scripts at regular intervals with cron. Scripts can compare current load to set limits. If limits are exceeded, scripts trigger alerts.
Simple monitoring scripts use commands like top or uptime. Scripts can save data to files for trends analysis. This helps spot patterns and predict problems early. Writing your own script lets you control monitoring details.
Credit: phoenixnap.com
Optimizing Performance
Optimizing performance is key to keeping a Linux system fast and efficient. High CPU load can slow down your computer and cause delays. Watching CPU load helps spot issues early. Fixing these issues improves system speed and stability.
Identifying Resource Hogs
Some programs use more CPU than others. These are called resource hogs. Use tools like top or htop to see which processes use the most CPU. Spotting these helps you understand what slows your system. Check CPU usage often to catch problems early.
Managing Running Processes
Stopping or restarting heavy processes can free up CPU power. Use the kill command to stop processes that use too much CPU. You can also change process priority with nice or renice. Manage running processes carefully to keep your system smooth and fast.
Credit: www.atlantic.net
Frequently Asked Questions
What Command Shows Cpu Load In Linux?
You can use the top or uptime commands to check CPU load. Top provides real-time details, while uptime shows load averages.
How To Interpret Cpu Load Averages On Linux?
Load averages represent the average system load over 1, 5, and 15 minutes. Values near CPU core count indicate normal load, higher means overload.
Which Tools Monitor Cpu Load In Linux?
Common tools include top, htop, vmstat, and mpstat. They provide detailed CPU load and performance metrics in different formats.
Can I Check Cpu Load Remotely On Linux?
Yes, you can SSH into a Linux server and use commands like top or uptime to check CPU load remotely.
Conclusion
Checking CPU load in Linux helps keep your system healthy. Use simple commands like top, uptime, or vmstat to see load details. Watching CPU load helps find slowdowns and fix problems early. Regular checks improve your system’s speed and reliability.
Try these easy steps to stay in control of your Linux machine. Keep your system running smoothly with these quick tips.