
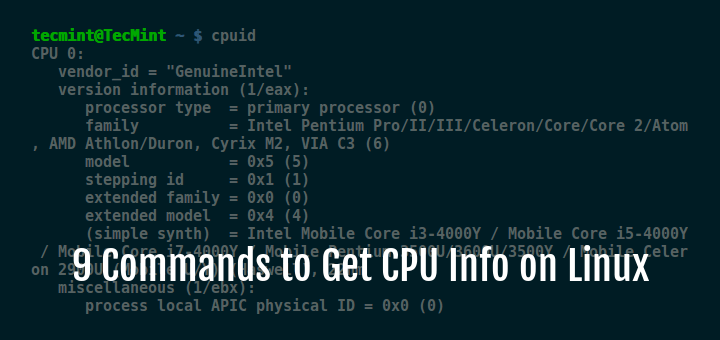
Are you curious about how your Linux system’s CPU is performing? Knowing how to check your CPU on Linux can help you spot issues early, improve your computer’s speed, and keep everything running smoothly.
Whether you’re a beginner or just want a quick refresher, this guide will show you simple and effective ways to see exactly what your CPU is doing right now. By the end, you’ll have the confidence to monitor your system like a pro—and keep your Linux machine in top shape.
Let’s dive in and get you started!
Check Cpu Info With Lscpu
Checking your CPU information on Linux is simple with the lscpu command. It offers a quick way to see detailed information about your processor. This command gathers data from system files and presents it clearly. You can find details like CPU architecture, cores, threads, and speed.
Using lscpu helps you understand your CPU’s capabilities. It is useful for troubleshooting and system optimization. Let’s explore how to use this command and understand its output.
Using The Lscpu Command
Open your terminal to start. Type lscpu and press Enter. The command runs instantly without any extra options. You will see a list of CPU details on your screen.
This command works on most Linux distributions. No installation is usually needed. It reads info from files like /proc/cpuinfo and shows a neat summary.
Interpreting Lscpu Output
The output has many lines, each showing a specific detail. Look for “Architecture” to know your CPU type. It might show x86_64 or arm.
“CPU(s)” tells the total number of cores available. “Thread(s) per core” shows how many threads each core runs. “CPU MHz” reveals the current speed of the processor.
Other useful fields include “Model name” for the CPU brand and model. “L1d cache” and “L1i cache” show cache sizes. These details help assess your CPU’s power and performance.
Credit: www.tecmint.com
Explore Cpu Details In /proc/cpuinfo
The /proc/cpuinfo file in Linux holds detailed information about your CPU. It is a virtual file that contains data directly from the kernel. This file helps you understand your CPU’s model, speed, cores, and more. You can access it easily through the terminal. It is useful for system checks and troubleshooting.
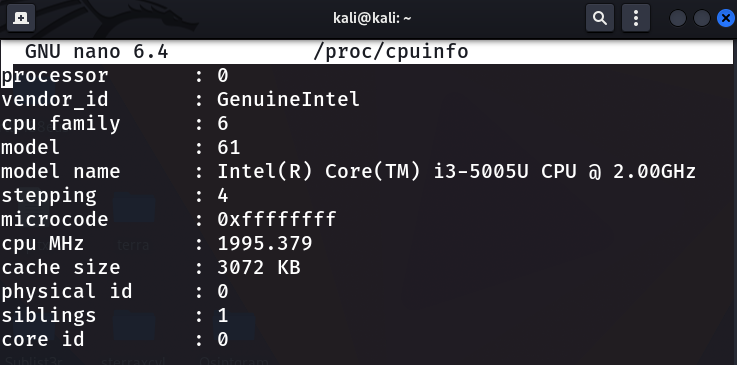
Viewing /proc/cpuinfo File
Open a terminal to see the CPU details. Type cat /proc/cpuinfo and press Enter. The terminal displays a list of CPU properties for each core. The output might be long, but it is well organized. You can scroll through or use commands like less to read it comfortably.
Each CPU core shows a separate block of information. This includes its processor number and other details. This method works on almost all Linux distributions without needing extra tools.
Key Fields To Note
Focus on important fields to understand your CPU better. The model name shows the CPU brand and model. The cpu MHz reveals the current speed of the processor. The cache size tells you about the CPU’s cache memory.
The flags field lists supported features and instructions. The cpu cores field shows how many cores your CPU has. The siblings field indicates the number of logical processors. These details help assess CPU performance and compatibility.
Using Top And Htop For Cpu Monitoring
Monitoring your CPU is important to keep your Linux system running smoothly. Two popular tools for this task are top and htop. Both show how your CPU is performing in real-time. They help you spot heavy programs and check system health. These tools run in the terminal and are easy to use.
Real-time Cpu Usage With Top
top is a default Linux tool that shows live CPU data. It lists running processes and their CPU use. The display updates every few seconds. You can see which programs use the most CPU power. Pressing keys like h shows help, and q quits the tool. It works on almost all Linux systems without extra setup.
Enhanced Monitoring With Htop
htop is a more user-friendly version of top. It uses colors to show CPU load and memory use. You can scroll through the list of processes easily. It supports mouse controls and lets you sort processes by CPU, memory, or time. You need to install htop on some systems first, but it offers a clearer view of your CPU status.
Credit: www.geeksforgeeks.org
Check Cpu Frequency And Cores
Checking the CPU frequency and cores helps you understand your computer’s power. The CPU frequency shows how fast your processor runs. The number of cores tells how many tasks it can handle at once. Both are important for system performance and troubleshooting.
Using Cpufreq-info
The cpufreq-info tool gives detailed CPU frequency information. It shows the current speed, minimum, and maximum frequencies. It also lists the available frequency steps and the governor in use.
To use it, open the terminal and type:
cpufreq-infoThis command displays frequency info for each CPU core separately. You can see how your CPU manages speed under different loads.
Counting Cpu Cores With Nproc
The nproc command quickly counts the number of CPU cores. It shows the total cores available to the system. This is useful to check how many cores your processor has.
Run this command in the terminal:
nprocThe output is a simple number, representing your CPU cores. This helps you understand the parallel processing ability of your machine.
Graphical Tools To Check Cpu Info
Graphical tools make checking CPU information on Linux easy and clear. They show details in a visual way. This helps users understand their system better. No need to use complex commands. You get a quick overview of CPU usage, speed, and cores. These tools are user-friendly and work well for beginners. Two popular tools are GNOME System Monitor and CPU-G.
Using Gnome System Monitor
GNOME System Monitor comes pre-installed on many Linux systems. It offers a simple interface to check CPU info. Open the tool from the applications menu. Click the “Resources” tab. You will see real-time CPU usage graphs. The tool also shows CPU frequency and core activity. It helps track system performance easily. No extra setup is needed for basic CPU monitoring.
Installing And Using Cpu-g
CPU-G is a lightweight tool for detailed CPU information. It is not installed by default. Install it using your package manager. For example, use sudo apt install cpu-g on Ubuntu. Launch CPU-G from the applications menu. It displays CPU model, speed, cache size, and more. The interface is clean and simple to read. CPU-G works well for users wanting more details than GNOME System Monitor.
Automating Cpu Info Retrieval
Automating CPU info retrieval saves time and effort. It helps you monitor your Linux system easily. With simple scripts and scheduled tasks, you can get CPU data regularly. This way, you stay informed without manual checks.
Creating Simple Shell Scripts
Shell scripts can fetch CPU information quickly. Use commands like lscpu or cat /proc/cpuinfo inside the script. Write the output to a file for easy review later. Save the script with a .sh extension and make it executable. Running the script gives you quick CPU details anytime.
Scheduling Cpu Checks With Cron
Cron lets you schedule tasks on Linux automatically. Add your shell script to the cron table to run at set times. For example, run it every hour to track CPU status. This keeps your CPU info updated without effort. Check cron logs to confirm the script runs as planned.

Credit: www.cyberciti.biz
Frequently Asked Questions
How To Check Cpu Information On Linux?
You can check CPU info using the command lscpu. It displays details like CPU architecture, cores, threads, and speed quickly in the terminal.
What Command Shows Cpu Usage In Linux?
Use the top or htop command to monitor real-time CPU usage. They provide active process info and CPU load percentages efficiently.
How To Find Cpu Temperature On Linux?
Install and run lm-sensors. It detects hardware sensors and shows CPU temperature to help monitor system health and prevent overheating.
Can I Check Cpu Model Through Linux Terminal?
Yes, run cat /proc/cpuinfo. It lists detailed CPU model, vendor ID, cache size, and other hardware specifics directly from the system.
Conclusion
Checking your CPU on Linux is simple and quick. Use basic commands like lscpu or cat /proc/cpuinfo. These tools give clear details about your processor. Knowing your CPU helps with system updates and software choices. Practice these steps often to stay aware of your hardware.
This knowledge keeps your Linux system running smoothly. Try these commands now and see your CPU info instantly.