
Are you curious about how busy your Linux system’s CPU really is? Knowing your CPU utilization helps you understand if your computer is running smoothly or struggling under heavy tasks.
You’ll discover simple and effective ways to check CPU usage on Linux. Whether you’re a beginner or just need a quick refresher, these easy steps will give you clear insights into your system’s performance. Keep reading, and take control of your Linux CPU like a pro!
Check Cpu Usage With Top Command
The top command is a popular tool to check CPU usage in Linux. It shows real-time system information. This helps you see how much CPU your processes use. top runs in the terminal and updates automatically.
Using top is simple and fast. It gives a clear view of CPU load and running tasks. You can spot high CPU users and understand system performance quickly.
Launch Top For Real-time Stats
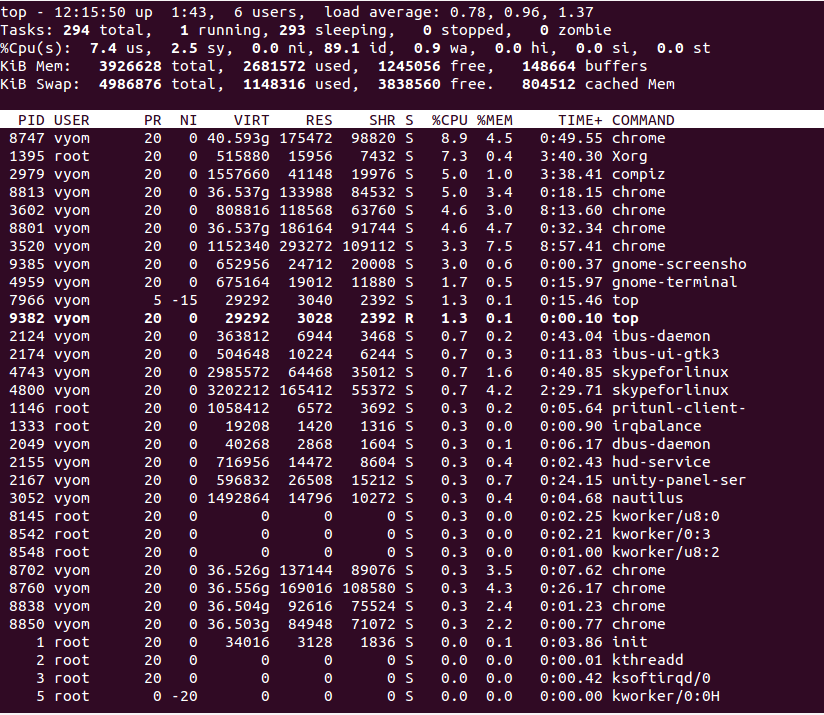
Open your terminal. Type top and press Enter. The screen will fill with data about your system.
The top part shows CPU, memory, and uptime. Below, it lists processes sorted by CPU use. The info refreshes every few seconds.
To exit top, press q. You return to the command prompt.
Interpret Cpu Usage Metrics
Look at the line starting with %Cpu(s):. It shows CPU usage breakdown.
usmeans user processes.symeans system processes.idmeans idle CPU.wameans waiting for I/O.
High us or sy means heavy CPU use. High id means low CPU load.
Customize Top Output
Press f to open fields management. Use arrow keys to add or remove columns.
Press z to change colors. Press c to show full command lines.
Press Shift + W to save your settings for next time.
Credit: www.atlantic.net
Use Htop For Interactive Monitoring
Htop is a powerful tool to watch CPU use in Linux. It shows real-time data in a clean, easy way. You can see all running processes and their CPU use. The interface is interactive, letting you control what you see. This makes it easier to find heavy CPU users fast.
Install Htop On Your System
Htop may not be installed by default. Use your package manager to add it. On Ubuntu or Debian, type sudo apt-get install htop. For Fedora, use sudo dnf install htop. On Arch Linux, run sudo pacman -S htop. Installation is quick and simple.
Navigate The Htop Interface
Open htop by typing htop in the terminal. The top shows CPU, memory, and swap use bars. Below, you see a list of processes. Use arrow keys to move up and down the list. Press F10 or q to quit. The interface updates every few seconds.
Filter And Sort Processes
Press F3 to search for a specific process. Type part of the name to filter the list. Press F6 to sort by CPU, memory, or other columns. Sorting helps spot processes using most CPU. You can kill or renice processes with F9 and F7/F8. This control helps manage CPU use quickly.
Monitor Cpu With Mpstat Tool
Monitoring CPU usage is vital for managing a Linux system’s performance. The mpstat tool provides detailed CPU statistics. It shows how much CPU time is spent on different tasks. This tool helps identify bottlenecks and high CPU usage areas.
Using mpstat is simple and effective. It works by collecting CPU data over time. You can see overall CPU usage or check each processor core separately. This makes it easier to spot problems in multi-core systems.
Install Sysstat Package
The mpstat tool is part of the sysstat package. Most Linux distributions do not install it by default. To use mpstat, install sysstat first.
Open a terminal and type the install command. On Debian or Ubuntu, use:
sudo apt-get install sysstatFor Red Hat, CentOS, or Fedora, run:
sudo yum install sysstatAfter installation, check if mpstat works by typing:
mpstatRun Mpstat For Detailed Reports
Run mpstat without options to get a quick CPU snapshot. It shows average CPU usage since the system started. To get updates every few seconds, use:
mpstat 2 5This runs mpstat every 2 seconds, 5 times. The output breaks down CPU time into user, system, and idle percentages. Watch for high user or system time, which means heavy CPU load.
Analyze Per-processor Usage
Multi-core CPUs need per-processor analysis. Add the -P option to see each core’s stats.
mpstat -P ALL 2 5This command shows CPU usage for all cores every 2 seconds, 5 times. You can spot which core is busier or overloaded. If one core runs at 100%, it may cause slowdowns.
Use this data to balance workloads or troubleshoot performance issues. Per-processor stats help in fine-tuning your Linux system efficiently.

Credit: www.cyberciti.biz
View Cpu Stats Using Vmstat
Vmstat is a simple tool to check CPU stats in Linux. It shows how your CPU and system perform in real time. You can see how busy the CPU is and what tasks it handles.
This tool helps you understand CPU usage without complex commands. It also reveals memory, swap, and system activity. Vmstat is useful for quick checks and long-term tracking.
Basic Vmstat Usage
Open the terminal and type vmstat. This command shows a snapshot of your system’s performance. To refresh every two seconds, use vmstat 2. Press Ctrl+C to stop.
The output lists several columns. Focus on CPU columns to see usage. This command is easy and fast for basic CPU checks.
Understand Cpu Time Fields
Vmstat shows CPU time split into user, system, and idle. us means CPU time running user processes. sy means time running system tasks.
id is the idle time when CPU is free. Low idle time means CPU is busy. High user or system time means active processing.
Track System Performance Over Time
Use vmstat 5 10 to get stats every five seconds, ten times. This helps spot patterns in CPU usage. Watch for spikes or steady high CPU times.
Logging this data helps find issues early. You can compare different times of day or workloads. Vmstat is great for ongoing system monitoring.
Check Cpu Load With Proc Filesystem
Checking CPU load on Linux is simple with the /proc filesystem. This virtual filesystem holds many system files. These files provide real-time information about the CPU and other system parts. You can use it to monitor your CPU without extra tools. It gives raw data that you can read and calculate. This method works on almost all Linux systems.
Read Cpu Info From /proc/stat
The file /proc/stat contains CPU statistics. You can view it by running cat /proc/stat. The first line starts with “cpu” and shows numbers. These numbers represent time spent by the CPU in different modes. Modes include user, system, idle, and others. Each value counts in units called jiffies. Reading this file gives a snapshot of CPU activity at that moment.
Calculate Cpu Usage Manually
To find CPU usage, read /proc/stat twice. Wait a short time between reads, like one second. Calculate the difference between values for each mode. Total CPU time equals the sum of all mode differences. Idle time equals the difference in the idle value. CPU usage equals total time minus idle time, divided by total time. Multiply by 100 to get a percentage. This method shows how busy the CPU was during that period.
Use Scripts For Automation
Manually calculating CPU usage can be slow and error-prone. Writing a script automates the process. Simple shell scripts can read /proc/stat and do math. Scripts can repeat checks at intervals. They can print CPU usage as a percentage. You can save these scripts and run them anytime. Automation helps track CPU load over time without manual work.
Graph Cpu Usage With Glances
Graphing CPU usage helps you understand how your system performs over time. Glances is a simple tool that shows CPU usage in real time with graphs. It gives clear visuals that help spot trends or problems quickly. This tool runs in the terminal, making it easy to use on any Linux system.
Install Glances Tool
First, install Glances on your Linux system. Open the terminal and type sudo apt-get install glances for Debian-based systems. For Red Hat-based systems, use sudo yum install glances. You can also install it with Python’s package manager by running pip install glances. The installation is fast and requires few steps.
Access Real-time Graphs
Run Glances by typing glances in the terminal. The CPU usage graph appears near the top. It updates every few seconds, showing current load and history. The graph uses bars or lines to display usage clearly. Watch how CPU cores behave under different tasks in real time.
Customize Monitoring Views
Glances allows you to change what you see on screen. Press keys like c to toggle CPU details or d for disk information. You can also adjust refresh rate with -t option, for example glances -t 5 updates every 5 seconds. Customize views to focus on CPU or other system parts easily.
Set Up Alerts For High Cpu Usage
Setting up alerts for high CPU usage helps catch problems early. It avoids system slowdowns and crashes. Alerts notify you when CPU use is higher than normal. This lets you act fast to fix issues. Simple tools and scripts can do this well.
Use Cron Jobs For Regular Checks
Cron jobs run tasks automatically at set times. You can create a script to check CPU usage. Set the cron job to run this script often. It can log CPU stats or trigger alerts. This keeps an eye on CPU without manual checks.
Integrate With Email Notifications
Email alerts send messages when CPU is too high. Scripts can use commands like mail to send emails. Combine this with cron jobs for automatic alerts. Emails reach you quickly, no matter where you are. This helps fix problems fast.
Employ Monitoring Tools Like Nagios
Nagios is a popular tool for monitoring servers. It tracks CPU and other system metrics all the time. Nagios can send alerts by email or SMS. It has a user-friendly dashboard for easy checking. This tool suits bigger systems needing detailed monitoring.

Credit: www.cyberciti.biz
Frequently Asked Questions
How Can I Check Cpu Utilization In Linux?
You can check CPU utilization using commands like top, htop, and mpstat. These tools provide real-time CPU usage stats on your Linux system efficiently.
What Linux Command Shows Detailed Cpu Usage?
The mpstat command shows detailed CPU usage per processor. It provides breakdowns of user, system, idle, and I/O wait times clearly.
How To Monitor Cpu Usage Continuously In Linux?
Use the top or htop command to monitor CPU usage continuously. They refresh data every few seconds, giving real-time insights.
Can I See Cpu Utilization For Specific Processes?
Yes, the top command lists CPU usage by process. You can sort or filter to find processes consuming the most CPU.
Conclusion
Checking CPU usage in Linux helps keep your system healthy. Use simple commands like top, vmstat, or mpstat to see real-time data. These tools show how much work your CPU is doing. Regular checks prevent slowdowns and catch issues early.
Practice using these commands often to get comfortable. Understanding CPU utilization improves how you manage your Linux system. Keep your system running smooth and fast with easy monitoring. Now, you can watch your CPU and stay in control.