
Are you curious about how busy your Linux system’s processor really is? Knowing your CPU utilization is key to keeping your computer running smoothly and avoiding slowdowns.
You’ll learn simple and effective ways to check your CPU usage in Linux. By the end, you’ll have the tools to monitor your system’s performance like a pro—no complicated jargon, just clear steps you can follow right now. Ready to take control of your Linux CPU?
Let’s dive in.
Check Cpu Usage With Top Command
The top command is a popular tool to check CPU usage on Linux. It shows real-time information about processes and system resources. This tool helps you see which tasks use the most CPU power. The interface updates every few seconds, giving live stats. It is simple to use and does not require extra installation on most Linux systems.
Running Top For Real-time Stats
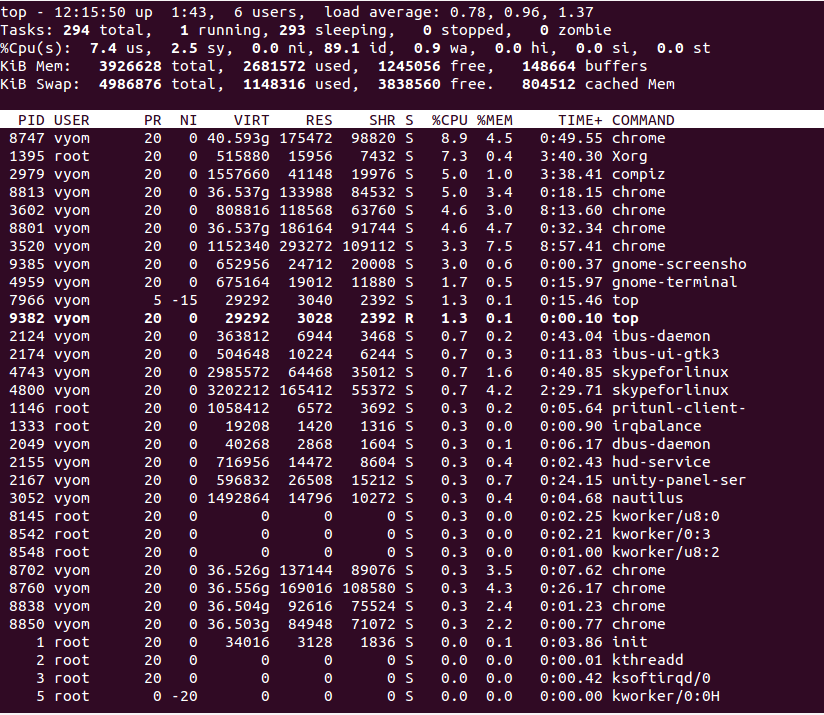
To start top, open a terminal and type top. Press Enter. The screen will display a list of active processes. The information refreshes automatically. You can watch CPU usage, memory, and process details. Press q to quit the program when done.
Interpreting Cpu Fields
The CPU section shows several fields. us means user space CPU time. sy shows system CPU time. id stands for idle CPU time. wa is time waiting for I/O operations. These numbers tell how busy the CPU is. High us or sy means the CPU is working hard. High id means the CPU is mostly idle.
Customizing Top Display
You can change how top looks. Press f to add or remove columns. Press z to toggle colors for better visibility. Use 1 to see CPU stats for each core. Press Shift + W to save your changes for future sessions. These options help you focus on the data you need.

Credit: www.cyberciti.biz
Monitor Cpu With Mpstat
Monitoring CPU usage is vital to keep your Linux system running smoothly. The mpstat tool provides detailed CPU statistics. It helps identify how your CPU resources are being used in real time.
This tool shows CPU usage per processor or overall. It is simple and effective for system monitoring and troubleshooting.
Installing Mpstat Tool
Most Linux systems do not have mpstat installed by default. You need to install the sysstat package.
On Debian or Ubuntu, run: sudo apt-get install sysstat.
For CentOS or RHEL, use: sudo yum install sysstat.
After installation, enable data collection with: sudo systemctl enable sysstat and sudo systemctl start sysstat.
Using Mpstat For Cpu Metrics
Open a terminal and type mpstat to see current CPU usage.
Run mpstat 1 5 to display CPU stats every second, five times.
This command shows average CPU usage, user time, system time, and idle time.
You can monitor individual CPUs with mpstat -P ALL 1 5.
Analyzing Mpstat Output
The output contains columns like %usr, %sys, %idle, and %iowait.
%usr shows CPU time spent on user processes.
%sys indicates CPU time used by system processes.
%idle tells you how much CPU is free.
%iowait shows CPU waiting for input/output operations.
High %idle means the CPU is mostly free. Low %idle means high usage.
Check these values to understand CPU load and detect bottlenecks.
Use Vmstat For Cpu And System Info
The vmstat command is a simple tool to check CPU and system information on Linux. It shows key details about processes, memory, paging, block IO, traps, and CPU activity. This tool helps you understand how your system uses resources at a glance.
You can run vmstat without extra setup. It works on most Linux systems and gives quick feedback. The output is easy to read once you know what each part means.
Basic Vmstat Usage
Open a terminal and type vmstat to see a snapshot of your system stats. The command shows averages since the last reboot.
Use vmstat 1 5 to get updates every second for five times. This gives a better view of current activity.
Reading Cpu Columns
The CPU section has four columns: us, sy, id, and wa.
usshows CPU time used by user processes.syshows CPU time used by system processes.idshows idle CPU time.washows time waiting for IO operations.
High id means your CPU is mostly free. High us or sy means your CPU is busy.
Continuous Monitoring
Run vmstat 2 to update stats every two seconds indefinitely. Press Ctrl+C to stop.
This helps track CPU usage trends over time. You can spot spikes or drops easily.
Use this for quick checks or during troubleshooting to see real-time system behavior.

Credit: www.cyberciti.biz
Read Cpu Stats From /proc/stat
Linux stores important CPU information in a special file called /proc/stat. This file shows how the CPU spends its time. Reading this file helps to understand CPU usage. It provides raw data that you can use to calculate CPU load. This method does not need extra tools. It works on almost all Linux systems.
Accessing /proc/stat File
Open a terminal on your Linux system. Use the command cat /proc/stat to display the file content. The first line starts with cpu. It shows total CPU usage from system start. The numbers after cpu are times spent in different modes. These include user, nice, system, idle, and others.
Calculating Cpu Usage Manually
Note the numbers from the first cpu line twice. Wait a few seconds between readings. Subtract the first reading from the second. The difference shows CPU time spent in each mode. Sum all differences to get total time. Calculate idle time difference too. Use this formula for CPU usage:
CPU Usage = (Total Time - Idle Time) / Total Time 100%
This gives the CPU percentage used during the interval. Repeat to track CPU load over time.
Scripting For Automation
Create a simple script to read and calculate CPU usage. Use a shell script with commands like cat and awk. Store two readings and wait a few seconds. Then calculate CPU load automatically. This saves time and avoids manual errors. Run the script anytime to get quick CPU usage data.
Check Cpu Load With Sar Command
The sar command is a powerful tool to check CPU load on Linux systems. It collects and reports system activity data, including CPU utilization. Using sar, you can monitor CPU performance over time. This helps you understand how busy your CPU is and identify performance issues quickly.
Installing Sysstat Package
The sar command comes with the sysstat package. First, install this package on your Linux system. Use your package manager to do this.
For Ubuntu or Debian, run: sudo apt-get install sysstat. For CentOS or RHEL, use: sudo yum install sysstat. After installation, enable the service to collect data continuously.
Running Sar For Cpu Data
To check CPU load, run the command sar -u 1 5. This shows CPU usage every second for five times. The output includes user, system, idle, and iowait percentages.
This real-time data helps you spot high CPU usage. It also shows how much CPU time is free. Use this command to monitor current CPU activity easily.
Scheduling Sar For Periodic Reports
You can schedule sar to collect CPU data automatically. The data is saved in log files for later analysis. This is done using cron jobs or systemd timers.
For example, enable the sysstat service with: sudo systemctl enable sysstat. This starts data collection at boot. Check the logs with sar -u -f /var/log/sysstat/saDD where DD is the day number.
Scheduling helps track CPU trends over days or weeks. It supports better system management and troubleshooting.
Graphical Tools For Cpu Monitoring
Graphical tools make it easy to check CPU usage on Linux. They show real-time data with clear visuals. This helps users understand system performance quickly. No need to use complex commands. Just open the app and watch the graphs.
Using Gnome System Monitor
GNOME System Monitor is common on many Linux systems. It shows CPU usage in a simple graph. You can see how each core performs. The interface is clean and easy to use. It also displays memory and network use. Ideal for beginners who want quick info.
Kde System Activity
KDE System Activity is part of the KDE desktop. It offers detailed CPU usage charts. You can track processes using the most CPU. It updates data in real time. The tool is flexible and can show more system details. Good for users with KDE desktop installed.
Third-party Gui Apps
Many third-party apps offer advanced CPU monitoring. Tools like Stacer and Glances have colorful dashboards. They provide more options than built-in monitors. Some apps can log CPU data over time. These are useful for deeper system analysis. Choose one that fits your needs and desktop environment.
Tips For Accurate Cpu Measurement
Getting accurate CPU utilization data in Linux requires careful measurement. Incorrect methods lead to wrong results. This section shares practical tips to improve accuracy. Follow these tips to monitor CPU use reliably.
Avoiding Short Sampling Periods
Short sampling times can show false CPU spikes. CPU load changes fast. Sampling for just a second may not reflect true usage. Use longer intervals like 5 or 10 seconds. It smooths out sudden changes. This helps see steady CPU performance.
Combining Multiple Tools
One tool alone can miss details. Combine commands like top, vmstat, and mpstat. Each tool shows different CPU data. Together, they give a clearer picture. Use them to cross-check your CPU readings.
Interpreting High Cpu Usage
High CPU use is not always bad. It can mean a program works hard or a problem exists. Check which process uses most CPU. Use ps or htop for this. High use during backups or updates is normal. Unexpected spikes may signal issues.
Credit: www.atlantic.net
Frequently Asked Questions
What Is Cpu Utilization In Linux?
CPU utilization measures how much processing power the CPU uses over time. It shows system load and performance efficiency.
How To Check Cpu Utilization Using Top Command?
Run the top command in Linux terminal. It displays real-time CPU usage and processes consuming resources.
Can I Get Cpu Utilization With Vmstat?
Yes, vmstat shows CPU usage statistics including user, system, idle, and wait times for performance analysis.
How To Monitor Cpu Utilization Using Mpstat?
Use mpstat to get detailed CPU usage per processor. It helps identify CPU bottlenecks and load distribution.
Conclusion
Monitoring CPU usage helps keep your Linux system healthy. You can check CPU utilization using simple commands. These tools give real-time data and help find problems fast. Regular checks prevent slowdowns and crashes. Use this guide to stay aware of your system’s performance.
Keep practicing these steps to feel confident managing Linux CPU usage. It’s easier than it seems. Stay curious, and your skills will grow with time.