
Are you curious about how much of your computer’s power is being used right now? Knowing how to check CPU usage on Linux can help you keep your system running smoothly and avoid slowdowns.
Whether you’re a beginner or just want a quick way to monitor your system, this guide will show you simple methods to see exactly what your CPU is doing. By the end, you’ll feel confident managing your Linux machine like a pro.
Ready to take control of your system’s performance? Let’s dive in!

Credit: runcloud.io
Monitor Cpu Usage Via Terminal
Monitoring CPU usage through the terminal is a quick way to check your system’s performance. It helps you see how much processing power your computer uses at any moment. This method works on almost all Linux systems and does not need extra software.
Using terminal commands is simple and fast. These commands give you detailed information about your CPU. You can find out which processes use the most CPU and how busy your system is overall.
Using Top Command
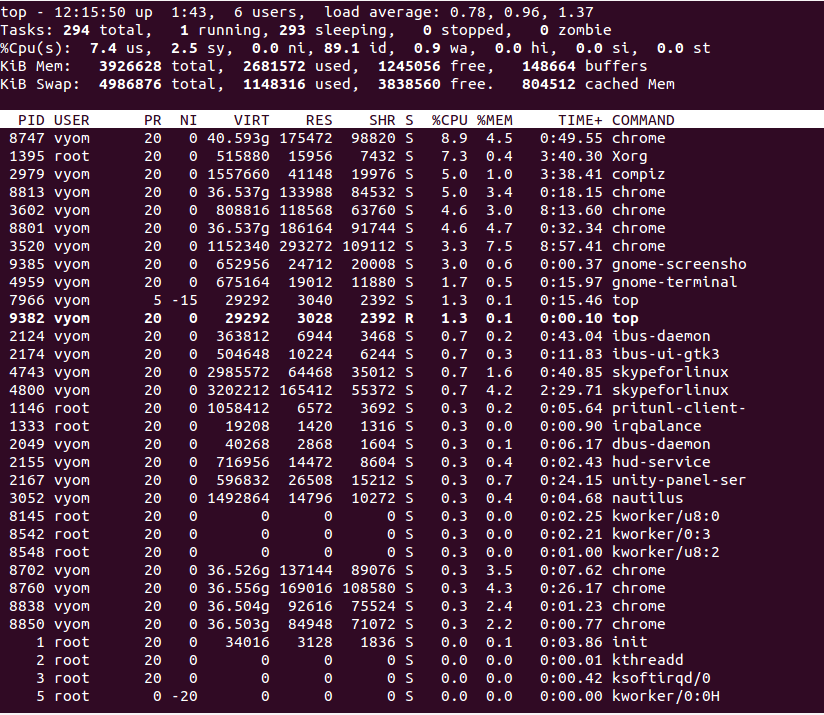
The top command shows real-time CPU usage. It lists running processes and their CPU consumption. Open the terminal and type top, then press Enter.
The display updates automatically every few seconds. Look at the “%CPU” column to see usage per process. The top line shows overall CPU activity.
Press q to exit the top view.
Using Htop For Enhanced View
htop is a more user-friendly version of top. It shows colorful graphs and is easier to read. Install it using your package manager if needed.
Run htop in the terminal. You will see CPU usage bars at the top. Processes are listed with CPU and memory details.
Use arrow keys to scroll and F10 to quit. htop lets you manage processes directly.
Using Mpstat For Detailed Stats
The mpstat command provides detailed CPU statistics. It shows usage for each CPU core separately. Install the sysstat package first if mpstat is missing.
Run mpstat -P ALL 1 to display stats every second. The output includes user, system, and idle CPU times.
This tool helps you understand how each core performs over time.
Check Cpu Load With Vmstat
Checking CPU load is important for understanding your Linux system’s performance. The vmstat tool provides detailed information about CPU usage, memory, and processes. It is simple to use and helps monitor system health effectively.
This tool shows statistics about the system’s virtual memory, processes, and CPU activity. Using vmstat, you can see how busy your CPU is and identify performance bottlenecks. It runs quickly and gives clear output.
Interpreting Vmstat Output
The vmstat output has several columns, each showing different system metrics. Focus on the CPU columns: us, sy, id, and wa.
us shows time spent on user processes. sy shows time on system processes. id is idle time. wa means waiting for I/O.
Low id and high us or sy mean heavy CPU use. High wa means CPU waits for disk or network operations. This helps spot if CPU or I/O limits slow the system.
Real-time Monitoring With Vmstat
Run vmstat with a delay to watch CPU load live. For example, vmstat 2 updates every two seconds.
This shows how CPU usage changes over time. You see spikes or drops in real-time. It helps detect short CPU spikes or sustained loads.
Stop with Ctrl+C. Use this for quick checks without installing extra tools. It is useful for admins and users wanting fast CPU insights.
Explore Cpu Usage With Sar
Explore CPU usage with sar, a powerful tool in Linux. It helps track CPU performance over time. Unlike real-time tools, sar records data and lets you review it later. This is useful for spotting trends and diagnosing issues.
sar is part of the sysstat package. It collects CPU, memory, and I/O statistics. Using it, you can see how your CPU behaves under different loads. This section shows how to install sysstat and analyze CPU data with sar.
Installing Sysstat Package
First, install the sysstat package. Open your terminal and enter the install command for your Linux distribution.
For Debian or Ubuntu, type:
sudo apt-get install sysstatFor CentOS or Fedora, use:
sudo yum install sysstatAfter installation, enable the sysstat service to start data collection:
sudo systemctl enable sysstat sudo systemctl start sysstatThis setup ensures sar collects CPU data automatically.
Analyzing Historical Cpu Data
Use sar to check CPU usage history. Run this command to see CPU activity for the current day:
sar -uThe output shows CPU usage in percentages. It includes user, system, and idle time.
To view data for a specific day, add the -f option with the data file path:
sar -u -f /var/log/sa/sa10This command shows CPU stats from the 10th day of the month.
You can also monitor CPU usage every few seconds by specifying intervals:
sar -u 5 3This collects data every 5 seconds, 3 times. It helps observe short-term CPU changes.
Credit: www.atlantic.net
Graphical Tools For Cpu Monitoring
Graphical tools make it easy to watch CPU usage on Linux. They show real-time data in a visual way. Users can see which programs use the most CPU power. These tools help to spot problems fast.
Most Linux systems come with built-in monitors. They use simple graphs and lists. You do not need to use the command line. Just open the app and watch the CPU activity.
Using Gnome System Monitor
GNOME System Monitor is popular on many Linux desktops. It shows CPU use in a clear graph. The main window lists all running processes. You can sort them by CPU usage.
Open it by searching “System Monitor” in the menu. The “Resources” tab displays CPU and memory usage. The graph updates every second. It helps to track CPU peaks easily.
Using Kde System Monitor
KDE System Monitor works well on KDE desktops. It also gives a real-time view of CPU use. The interface shows CPU load on all cores.
Launch it from the application launcher. Look under the “Processes” tab for detailed info. The “System Load” tab shows graphs for CPU, memory, and network.
You can add widgets to the desktop for quick CPU checks. The tool is simple but very effective for monitoring.
Automate Cpu Usage Alerts
Automating CPU usage alerts helps you track system health without constant checks. It saves time and prevents system crashes by notifying you early. Setting up simple scripts and scheduling them ensures alerts run smoothly. This way, you stay informed about CPU spikes or unusual activity.
Setting Up Simple Bash Scripts
Create a bash script to monitor CPU usage quickly. Use commands like top or mpstat to get CPU stats. Add a check to compare current usage against a set limit. If usage passes the limit, send an alert via email or log it. Keep the script short and clear for easy updates later.
Using Cron For Scheduled Checks
Cron runs your bash script at set times automatically. Edit the crontab file with crontab -e to add your task. For example, run the script every 5 minutes to catch high CPU use early. Cron handles timing, so you don’t have to run scripts manually. This keeps your system under constant watch without extra effort.

Credit: www.cyberciti.biz
Troubleshoot High Cpu Usage
High CPU usage can slow down your Linux system. It may cause programs to lag or stop working. Troubleshooting helps find and fix the cause of the high CPU load. This guide shows simple steps to check and manage CPU use.
Start by identifying which processes use the most CPU power. Then, learn how to control or stop these processes safely. This approach keeps your system running smoothly.
Identifying Resource-heavy Processes
Use the top command to see active processes and CPU use. It updates in real-time. Look at the %CPU column to find the biggest users. Another tool is htop, which offers a colorful, easier view.
Try ps aux --sort=-%cpu | head -n 10 to list the top 10 CPU-consuming processes. This command helps spot the problem quickly. Keep an eye on processes that use more than 50% CPU for a long time.
Managing Processes To Reduce Load
Once you find the heavy processes, decide how to handle them. Use kill [PID] to stop a process by its ID. Replace [PID] with the actual process ID. For stubborn processes, use kill -9 [PID].
Try to restart services that cause high CPU use. Use commands like systemctl restart [service]. Adjust or update software causing problems. This often lowers CPU usage without stopping the service.
Frequently Asked Questions
How Can I Check Cpu Usage On Linux Terminal?
Use commands like top, htop, or mpstat in the terminal. They provide real-time CPU usage stats. These tools show CPU load per core and overall system usage easily.
Which Linux Command Shows Detailed Cpu Usage?
The mpstat command displays detailed CPU usage per processor. It provides user, system, idle, and I/O wait times. It’s part of the sysstat package and useful for precise monitoring.
How To Monitor Cpu Usage Continuously On Linux?
Run top or htop commands for continuous CPU monitoring. They refresh stats every few seconds, showing live CPU and process usage. Htop offers a user-friendly interface with color codes.
Can I Check Cpu Usage Using Linux Gui Tools?
Yes, tools like GNOME System Monitor or KDE System Monitor show CPU usage graphically. These apps provide easy-to-understand charts and detailed process info, ideal for users preferring a GUI.
Conclusion
Checking CPU usage on Linux helps keep your system healthy and fast. Use simple commands like top, vmstat, or mpstat to monitor it. Regular checks can spot problems early and improve performance. Stay aware of your CPU load to avoid slowdowns or crashes.
Practice these steps often to manage your Linux system well. This knowledge makes your computer work smoother every day.