
Are you wondering how busy your Linux system’s CPU really is? Knowing your CPU utilization helps you understand if your computer is running smoothly or struggling under heavy tasks.
If you want to keep your system fast and responsive, you need to monitor this key metric regularly. You’ll learn simple and effective ways to check your CPU usage in Linux. By the end, you’ll have the tools to spot problems early and keep your system performing at its best.
Ready to take control of your Linux CPU? Let’s dive in!
Credit: phoenixnap.com
Check Cpu Usage With Top Command
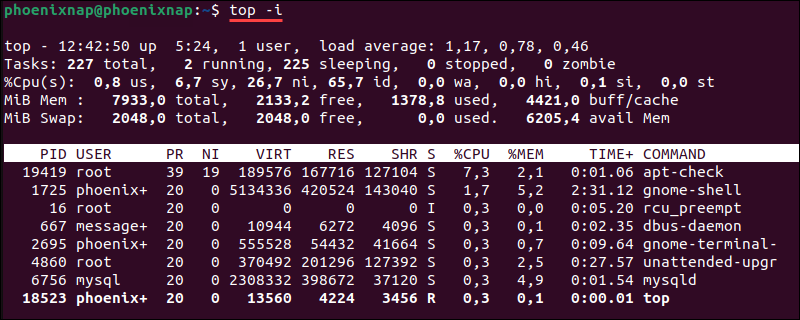
The top command is a simple tool to check CPU usage on Linux. It shows real-time system stats. You can see which processes use the most CPU power. This helps find problems or check system health quickly.
Using top does not need special setup. It runs in the terminal and updates every few seconds. This live view keeps you informed about CPU load and other key metrics.
Basic Top Command Usage
Open your terminal and type top. Press Enter to start. The screen will fill with data about processes and system resources. Look at the top section for CPU details. To exit, press q.
Interpreting Cpu Statistics
The CPU stats appear in a line starting with “%Cpu(s)”. It shows how CPU time splits into user, system, idle, and other parts. High “us” means user processes use CPU. High “id” means CPU is mostly idle. Check these to know CPU load.
Customizing Top Output
Press 1 inside top to see each CPU core usage. Use keys like h for help or z for color. You can sort by CPU by pressing P. This makes it easier to find heavy CPU users.

Credit: runcloud.io
Using Mpstat For Cpu Monitoring
Mpstat is a simple tool to check CPU usage on Linux. It shows detailed stats about CPU performance. This helps you understand how your system handles tasks. Mpstat reports CPU load by individual processors or all cores combined. You can spot high CPU use or bottlenecks quickly.
Installing Mpstat
Most Linux systems do not have Mpstat by default. You need to install the sysstat package to get it. Use your package manager to install easily.
For Ubuntu or Debian, type:
sudo apt-get install sysstatFor CentOS or Fedora, type:
sudo yum install sysstatAfter installation, enable the service to start collecting data.
Reading Mpstat Output
Run mpstat to see CPU stats. The default shows average CPU use since boot. Key columns include:
- %usr: CPU time spent on user processes.
- %sys: CPU time used by system processes.
- %idle: CPU time spent idle.
Low idle percent means CPU is busy. High user or system usage means heavy processing. Watch for high %iowait which shows waiting for disk.
Tracking Cpu Over Time
To monitor CPU over time, use:
mpstat 5 10This runs mpstat every 5 seconds, 10 times. It helps track CPU spikes or trends. You can save output to a file for later review.
Regular checks help keep your system healthy and responsive.
Analyzing Cpu Load With Vmstat
Analyzing CPU load is essential to understand system performance. The vmstat tool helps monitor CPU usage quickly. It shows data about processes, memory, and CPU in real time. This tool is simple and powerful for Linux users. Let’s explore how to use vmstat to check CPU load effectively.
Running Vmstat Command
Open your terminal to start using vmstat. Just type vmstat and press Enter. The command shows a snapshot of system statistics. You can add numbers to repeat the output every few seconds. For example, vmstat 2 5 runs it every 2 seconds, five times. This helps track CPU changes over time.
Key Cpu Metrics To Watch
Focus on columns like us, sy, and id. us means CPU time running user processes. sy shows time spent on system tasks. id is the idle time when CPU is free. High us or sy means busy CPU. High id means the CPU has spare capacity.
Using Vmstat For Performance
Use vmstat to identify CPU bottlenecks. If us and sy stay high, your CPU may be overloaded. This can slow down your system. Low id means little CPU idle time. Track these stats while running applications. It helps detect performance issues early. You can take action before problems grow.
Getting Cpu Info From /proc/stat
The /proc/stat file in Linux contains valuable CPU information. It shows how much time the CPU spends on different tasks. This data helps measure CPU utilization.
Reading /proc/stat is simple and quick. It provides raw CPU statistics since the system started. Understanding this file allows monitoring CPU performance effectively.
Accessing Cpu Data
Open a terminal and type cat /proc/stat. The first line starts with cpu. It shows cumulative CPU time in different modes.
The numbers represent time spent in user, nice, system, idle, iowait, irq, softirq, steal, and guest modes. These values are in jiffies, a unit of time.
Calculating Cpu Utilization
To calculate CPU usage, take two snapshots of CPU data. Wait a short time between readings, like one second.
Subtract the first values from the second to get time spent in each mode during that interval. Use the formula:
CPU Usage = 100 (Total - Idle) / Total
Here, Total is the sum of all mode times. Idle is the time CPU was idle. This formula gives the percentage of CPU used.
Writing Custom Scripts
Create a script to automate CPU usage calculation. Use shell scripting or Python for easy parsing of /proc/stat.
The script reads the CPU line twice. Then calculates the difference and CPU usage percentage. Display or log the results for monitoring.
Such scripts help track CPU load over time without manual effort. They are useful for system administrators and developers.
Employing Sar For Detailed Cpu Stats
Employing sar provides detailed CPU usage statistics on Linux systems. This tool collects and reports system activity, helping track CPU performance over time. It offers a clear view of how the CPU handles tasks, showing user, system, idle, and iowait times.
Using sar helps identify CPU bottlenecks and optimize resource use. It records data periodically, making it easier to analyze trends and spot issues before they affect system performance.
Enabling Sar Data Collection
First, install the sysstat package if it is missing. Use your package manager, like apt or yum. After installation, enable the data collection service. This service runs in the background and gathers CPU stats automatically.
Check if the service is active with systemctl status sysstat. Start it using systemctl start sysstat if needed. Enable it to run at boot with systemctl enable sysstat. This setup ensures continuous data collection for accurate reports.
Interpreting Sar Reports
Run sar -u to display CPU usage for the current day. The report shows percentages of CPU time spent in user, system, idle, and iowait modes. User time means CPU is running user processes. System time shows CPU work on system tasks.
Idle time indicates CPU is free, while iowait shows waiting on disk or network. High idle time means low CPU load. High user or system time means heavy CPU use. Use this data to find performance problems and improve system efficiency.
Scheduling Sar Monitoring
Automate sar data collection using cron jobs. The sysstat package usually configures this automatically. Cron runs the sar data collector every 10 minutes by default.
To customize, edit the cron file at /etc/cron.d/sysstat. Adjust intervals to gather more or less frequent data. Scheduled monitoring helps maintain continuous insight into CPU usage. This ongoing data supports better system management and troubleshooting.

Credit: www.cyberciti.biz
Graphical Tools For Cpu Usage
Graphical tools offer an easy way to check CPU usage on Linux. They provide visual data that helps you understand system performance quickly. These tools are user-friendly and show real-time CPU activity. You do not need to use commands or scripts. Just open the app, and you can see the CPU load, processes, and more.
Using Gnome System Monitor
Gnome System Monitor is a popular tool for Linux users with the Gnome desktop. It shows CPU usage in a simple graph. You can see the percentage of CPU used by each process. It also displays memory and network usage. The tool updates in real time. It helps to spot heavy CPU users easily.
Ksysguard Features
Ksysguard is the default system monitor for KDE desktop users. It offers detailed CPU usage stats. The app displays multiple CPU cores separately. It provides graphs for CPU load, memory, and disk activity. You can customize what data to show. Ksysguard also supports remote monitoring of other Linux machines.
Third-party Cpu Monitoring Apps
Many third-party apps show CPU usage with more features. Tools like Conky and Stacer provide customizable displays. They offer detailed charts and alerts for CPU spikes. These apps often include system cleanup and optimization features. You can install them easily on most Linux distributions. Third-party tools add flexibility for advanced users.
Automating Cpu Monitoring
Automating CPU monitoring helps track your system’s performance without manual checks. It saves time and catches issues early. Automation ensures you get alerts and logs for better analysis. Set up tools to watch CPU use constantly and respond fast to problems.
Setting Up Alerts
Create alerts to notify you when CPU use is too high. Use simple scripts with tools like cron and bash to check CPU load regularly. Send email or messages if CPU crosses a set limit. Alerts help prevent slowdowns and crashes by acting quickly.
Logging Cpu Usage
Keep a record of CPU usage over time. Use commands like top, vmstat, or mpstat in scripts to save data to log files. Logs help find patterns and diagnose problems later. Store logs on your server or send them to a central location.
Integrating With Monitoring Systems
Connect CPU monitoring to systems like Nagios, Zabbix, or Prometheus. These tools collect data, show graphs, and alert you automatically. Integration helps manage multiple servers easily. Use plugins or APIs to link your CPU data with these platforms for better oversight.
Frequently Asked Questions
What Command Shows Cpu Utilization In Linux?
The top command provides real-time CPU usage in Linux. It displays CPU load along with running processes and system resource usage.
How To Check Cpu Usage With The Mpstat Command?
Run mpstat to get CPU usage statistics per processor. It reports user, system, idle, and iowait CPU times clearly.
Can I Monitor Cpu Utilization Using Vmstat?
Yes, vmstat shows CPU usage along with memory and I/O stats. It helps track CPU idle and wait times effectively.
What File Contains Cpu Usage Info In Linux?
The /proc/stat file holds CPU time information. Reading it shows detailed CPU usage metrics used by many monitoring tools.
Conclusion
Checking CPU usage in Linux helps keep your system healthy. Use simple commands like top, vmstat, or mpstat to see real-time data. Regular monitoring prevents slowdowns and catches problems early. Understanding CPU utilization makes managing your Linux system easier. Keep practicing these steps to stay confident and aware of your system’s needs.
This knowledge saves time and improves performance.