
Are you wondering how to keep an eye on your OpenShift cluster’s performance? Knowing how to check Node CPU utilization is key to ensuring your applications run smoothly.
When CPU usage spikes unexpectedly, it can slow everything down or even cause outages. But don’t worry—this guide will show you simple, effective ways to monitor your nodes’ CPU load. By the end, you’ll have the tools to catch issues early and keep your OpenShift environment running at its best.
Ready to take control of your cluster’s health? Let’s dive in.
Credit: docs.redhat.com
Accessing Openshift Cluster
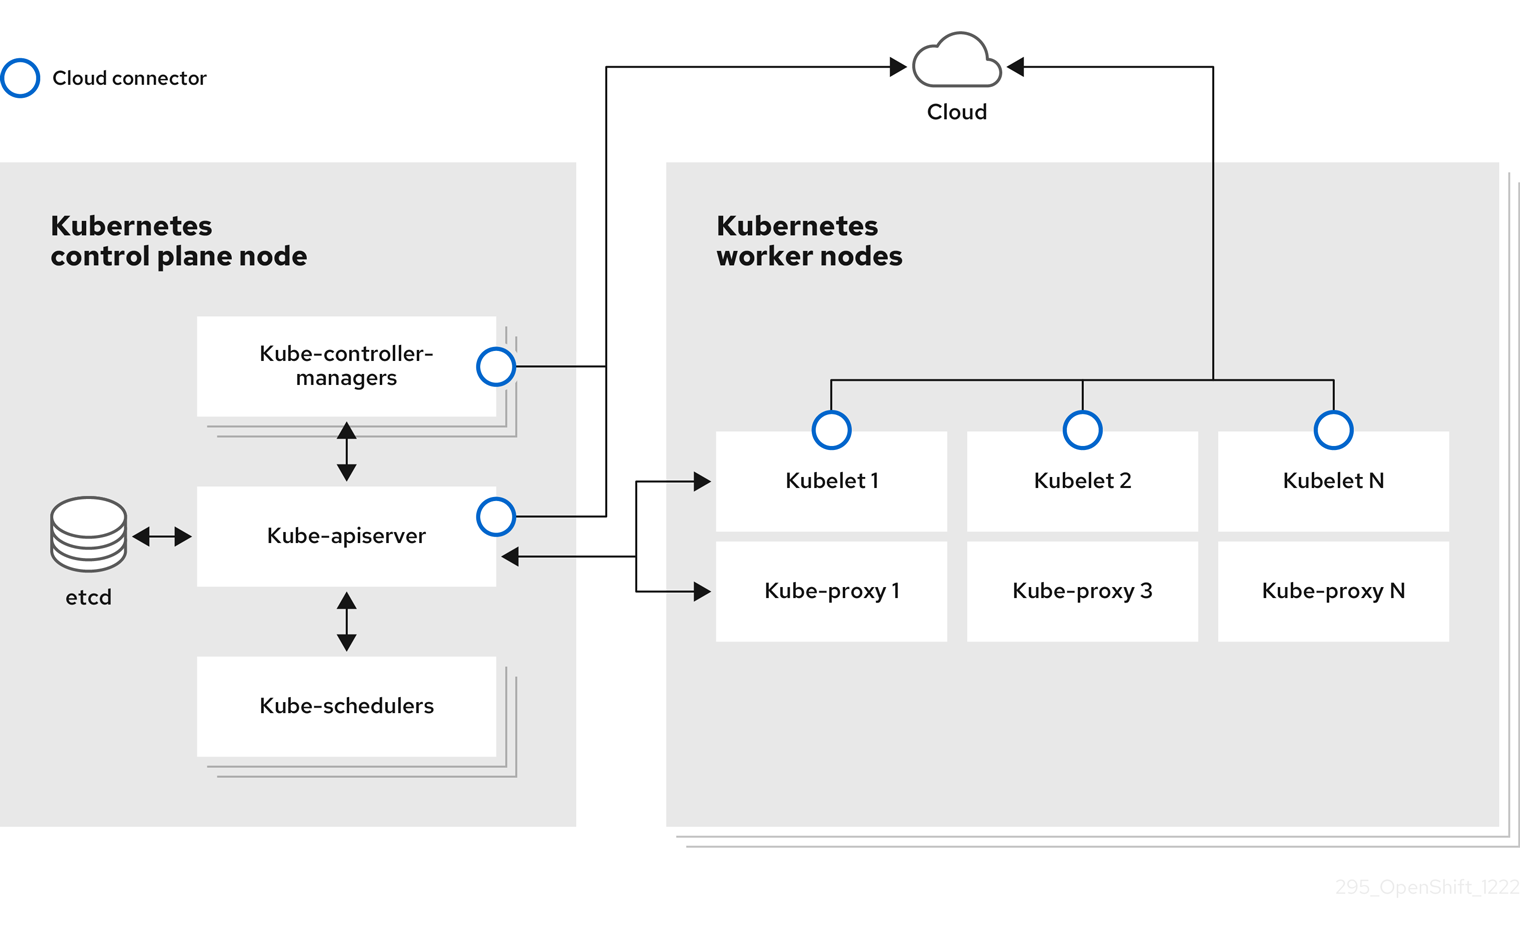
Accessing an OpenShift cluster is the first step to check node CPU utilization. Without access, you cannot monitor or manage the cluster resources. The cluster holds all the data and controls the nodes where your applications run. This section explains how to access the cluster easily.
Using Oc Command Line Tool
The oc command line tool is the main way to interact with OpenShift. It works like a control panel for your cluster. You can run commands to get information about nodes, pods, and more. Install the oc tool on your computer to start.
Once installed, use commands to connect and manage your cluster. The tool helps you check CPU usage and other node details. It is simple but powerful for cluster management.
Logging Into The Cluster
Logging into the cluster requires authentication. Use your username and password or a token to log in. Enter the command oc login followed by the cluster URL. This connects your terminal to the cluster securely.
After login, you can run commands to view node status and CPU use. Always keep your login details safe. This step opens the door to monitor your OpenShift cluster effectively.

Credit: stackoverflow.com
Checking Node Metrics
Monitoring CPU usage on nodes is key to keeping OpenShift clusters healthy. It shows how much processing power each node uses. This helps find busy or overloaded nodes fast. Tracking node metrics can prevent slow apps and downtime.
You can check CPU usage with built-in OpenShift commands. These give a quick view of node performance. Understanding the output is important for making smart decisions about resources. Let’s explore how to check node CPU use and read the data.
Usingoc adm top nodes Command OpenShift provides the oc adm top nodes command to show node metrics. Run it in your terminal connected to the cluster. This command displays current CPU and memory use per node. It helps spot nodes under heavy load.
Example:
oc adm top nodesThe output lists nodes with CPU and memory use in percentage and cores. It updates in real time, giving fresh data each time you run it.
Interpreting Cpu Usage Data
The CPU column shows how much CPU the node uses. Values are in cores or millicores. A node with 2000m means it uses 2 CPU cores. Watch for nodes near or at full CPU capacity.
High CPU use can slow pods or cause failures. Low CPU use means spare capacity available. Compare CPU use across nodes to balance workloads. This helps keep the cluster running smoothly.
Using Metrics Server
The Metrics Server is a key tool in OpenShift for checking CPU use on nodes. It collects resource data and makes it easy to see the CPU load. This helps in managing your cluster efficiently. The server works by gathering real-time metrics from each node.
Using the Metrics Server simplifies monitoring tasks. It provides quick access to CPU usage without heavy setup. Operators can spot problems early and keep the system running smoothly.
Installing Metrics Server
Start by installing the Metrics Server in your OpenShift cluster. Use the official OpenShift commands or YAML files. Ensure your cluster has the right permissions for Metrics Server to run. Check that the API aggregation layer is enabled. After installation, verify that the Metrics Server pods are running.
Retrieving Node Cpu Data
Once installed, use the command line to get CPU data. Run oc get --raw /apis/metrics.k8s.io/v1beta1/nodes to see node metrics. The output shows CPU use in millicores. You can also use oc adm top nodes for a simpler view. This command displays CPU and memory use for all nodes. Regular checks help maintain cluster health and avoid overloads.
Monitoring With Prometheus
Monitoring node CPU utilization in OpenShift is key to keeping your cluster healthy. Prometheus is a popular tool that collects and stores metrics data. It helps you track CPU usage over time. This makes it easier to spot problems early and keep your applications running smoothly.
Prometheus comes integrated with OpenShift by default. It collects metrics from all nodes and pods automatically. You can use its powerful query language to get detailed insights. This section explains how to access the Prometheus dashboard and query node CPU metrics.
Accessing Prometheus Dashboard
Start by logging into your OpenShift web console. Navigate to the Monitoring section. Here, you will find a link to the Prometheus dashboard. Click the link to open the dashboard in a new tab.
The dashboard shows real-time metrics from your cluster. You can explore different charts and panels. Use the search bar to find specific metrics, like node CPU usage. The interface is user-friendly, even for beginners.
Querying Node Cpu Metrics
Use Prometheus Query Language (PromQL) to fetch CPU data. A common query is rate(node_cpu_seconds_total{mode="idle"}[5m]). This shows CPU idle time per node over the last 5 minutes.
To find CPU utilization, subtract idle time from total CPU time. For example, use 1 - rate(node_cpu_seconds_total{mode="idle"}[5m]). This returns the CPU usage percentage per node.
Run the query in the Prometheus dashboard’s query box. Results appear as graphs or tables. Adjust the time range to see historical or current CPU usage. This data helps you decide when to scale or investigate issues.
Visualizing Cpu Usage
Visualizing CPU usage helps monitor node performance in OpenShift. It shows how much CPU each node uses. This information helps spot problems early. It also aids in balancing workloads effectively. Clear visuals make data easy to understand. Users can track trends over time. This section explains two ways to see CPU usage clearly.
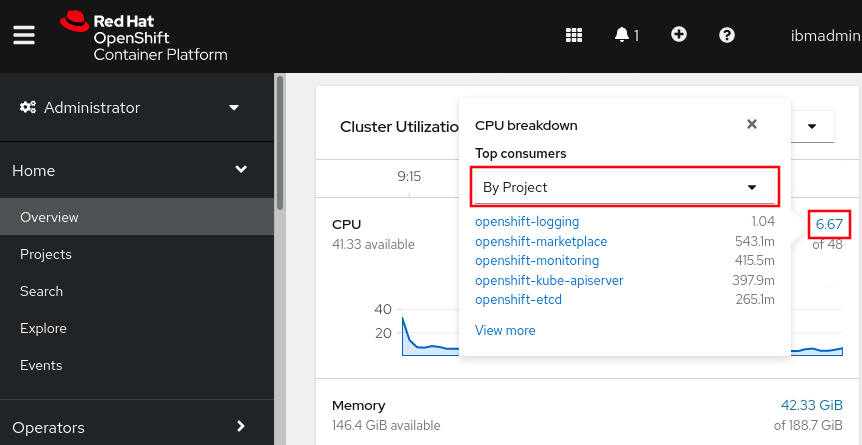
Using Openshift Console
The OpenShift Console offers built-in tools for CPU monitoring. It shows real-time CPU usage per node. Navigate to the Nodes section to view details. Each node displays current CPU load and trends. The graphs update automatically for live monitoring. This method is simple and requires no extra setup. It suits users who want quick insights. The interface is user-friendly and easy to navigate.
Integrating Grafana Dashboards
Grafana provides advanced dashboards for detailed CPU metrics. It connects with OpenShift metrics for accurate data. Users can customize graphs to focus on specific nodes. Dashboards support alerts for high CPU usage. This tool helps analyze long-term performance trends. Setting up Grafana requires some initial configuration. It benefits users who need in-depth monitoring. The visualizations are clear and interactive for better analysis.
Automating Cpu Checks
Automating CPU checks helps maintain node health in OpenShift. It saves time and avoids constant manual monitoring. Automation provides quick insights into CPU usage. It alerts teams before issues become critical. This section covers simple ways to automate CPU monitoring.
Creating Scripts With Oc Commands
Scripting with oc commands lets you gather CPU data easily. Write scripts to run commands like oc adm top nodes. This command shows current CPU usage for all nodes. Save output to files for logging or review. Automate scripts to run at set intervals. Use basic shell scripting to parse and filter results. This method reduces manual checks and improves accuracy.
Setting Up Alerts For High Cpu
Alerts notify teams when CPU usage is too high. OpenShift supports alerts via Prometheus and Alertmanager. Define CPU thresholds that trigger warnings or critical messages. Configure alerts to send emails or messages to your team. Alerts help act quickly to avoid downtime. Setting alerts automates monitoring and keeps your cluster stable.
Credit: publib.boulder.ibm.com
Frequently Asked Questions
How Do I Check Node Cpu Utilization In Openshift?
You can check node CPU utilization using OpenShift CLI with the command oc adm top nodes. This shows CPU and memory usage for each node in the cluster, helping you monitor resource consumption effectively.
What Tools Monitor Cpu Usage In Openshift Nodes?
OpenShift uses built-in tools like oc adm top and integrates with Prometheus for detailed CPU metrics. These tools provide real-time CPU data, enabling efficient node performance monitoring and troubleshooting.
Why Is Monitoring Node Cpu Utilization Important?
Monitoring CPU utilization helps ensure nodes are not overloaded. It prevents performance issues, allows resource optimization, and maintains cluster stability by identifying bottlenecks early.
Can I Automate Cpu Utilization Alerts In Openshift?
Yes, OpenShift supports alerting through Prometheus and Alertmanager. You can set CPU usage thresholds to trigger notifications, helping proactively manage node health and avoid downtime.
Conclusion
Checking node CPU utilization in OpenShift helps keep your cluster healthy. Use simple commands to see CPU usage clearly. Watch your nodes often to spot problems early. Good monitoring avoids slowdowns and downtime. Keep your OpenShift environment running smooth and fast.
Small checks lead to big improvements. Stay aware, stay in control.