
Are you curious about how much of your computer’s power is being used at any moment? Knowing your CPU usage in Linux can help you spot problems before they slow you down.
Whether you want to optimize your system’s performance or simply understand what’s running behind the scenes, this guide will show you easy ways to check your CPU usage. By the end, you’ll have simple tools and tricks that put you in control of your Linux system’s performance.
Keep reading to discover how to see exactly what your CPU is doing right now.
Check Cpu Usage With Top Command
The top command is a simple and effective tool to check CPU usage on Linux. It provides real-time information about system processes and resource use. This tool helps to understand which processes use the most CPU power. It runs directly in the terminal and updates data regularly.
Using top requires no special setup. It is available on almost all Linux systems. Just open your terminal and run the command to see live CPU stats. This section explains how to use top, read its output, and customize the view.
Running Top In Terminal
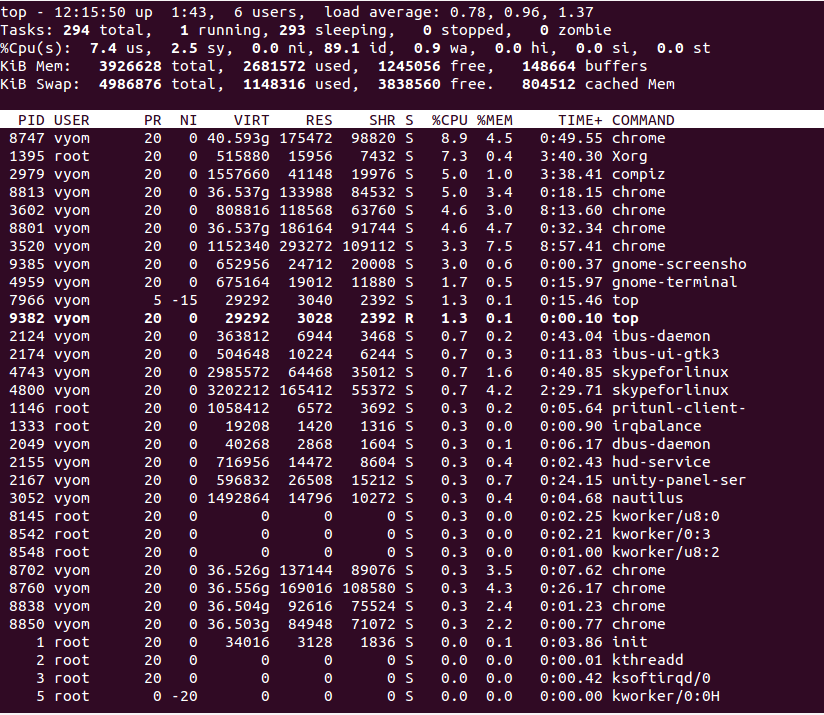
Open your terminal window. Type top and press Enter. The screen will fill with data about running processes. The display updates every few seconds. To exit, press q. No installation is needed for most Linux versions.
Interpreting The Output
The top part shows overall CPU usage, memory, and uptime. Look for lines starting with %Cpu(s). These show CPU use split into user, system, and idle time. Below, processes are listed by CPU use. The first columns show process ID and user. The %CPU column shows how much CPU a process uses.
Customizing The Display
Press h inside top for help. Use keys like c to show full command lines. Press Shift + P to sort by CPU use. Use Shift + M to sort by memory use. You can change update speed with d. These options help focus on data you want.
Using Htop For Visual Cpu Monitoring
Htop is a popular tool for checking CPU usage on Linux. It shows real-time data in a clear, colorful display. This helps users see which processes use the most CPU power. Htop is easier to read than traditional command-line tools. It also lets you interact with the list of processes directly. This makes managing tasks simple and fast.
Installing Htop
Most Linux versions do not have Htop installed by default. You can add it using your system’s package manager. For Ubuntu or Debian, run sudo apt-get install htop. On Fedora, use sudo dnf install htop. For Arch Linux, type sudo pacman -S htop. Installation takes only a few seconds.
Navigating The Interface
Open Htop by typing htop in the terminal. The screen shows CPU bars at the top with different colors. These bars display total CPU use and individual cores. Below, you see a list of running processes. Each row shows process ID, user, CPU, and memory use. Use arrow keys to move up or down in the list.
Filtering And Sorting Processes
Htop allows filtering to find specific processes fast. Press F3 and type the process name to filter. Sorting helps to organize the list by CPU, memory, or time. Press F6 to open the sort menu. Select the metric you want to sort by. This helps to focus on the most resource-heavy processes.
Monitor Cpu With Mpstat Command
Monitoring CPU usage is essential for managing system performance. The mpstat command helps track CPU activity on Linux systems. It shows detailed CPU statistics in real time. Users can see how much CPU is used by user processes, system processes, and idle time. This tool is useful for spotting CPU bottlenecks or unusual system behavior.
Installing Sysstat Package
The mpstat command is part of the sysstat package. Most Linux distributions do not install it by default. Install the package using your system’s package manager. For example, on Ubuntu or Debian, run:
sudo apt-get install sysstatOn CentOS or RHEL, use:
sudo yum install sysstatAfter installation, enable the service to start collecting data:
sudo systemctl enable sysstat sudo systemctl start sysstatThis setup allows mpstat to provide accurate CPU usage reports.
Basic Mpstat Usage
Run mpstat without options to see CPU stats since boot:
mpstatTo update CPU stats every 2 seconds, run:
mpstat 2This command outputs CPU usage at 2-second intervals until stopped. Use mpstat -P ALL to view all CPU cores individually. This helps identify if a specific core is overloaded. The output columns include user, system, idle, and iowait percentages.
Analyzing Cpu Statistics
Focus on the %idle and %usr columns. Low idle means high CPU usage. High user time shows heavy application load. High system time indicates kernel or driver activity. Watch for increased %iowait as it shows CPU waiting for disk input/output.
Compare stats over time to identify trends. Sudden spikes may signal problems. Use mpstat reports to optimize applications and system settings. This helps maintain smooth performance and avoid slowdowns.
Credit: www.atlantic.net
Check Cpu Usage Via /proc/stat File
Checking CPU usage through the /proc/stat file gives a direct look at how your Linux system handles processing tasks. This file holds detailed CPU statistics that the kernel collects. You can use this data to understand CPU activity without extra software. It is a powerful way to monitor system performance in real time.
The data format is simple but requires careful reading. The file lists time spent by the CPU in different modes, such as user, system, idle, and others. By comparing these values over time, you can calculate CPU usage percentage. This method is useful for scripts and custom monitoring tools.
Accessing Cpu Data
Open the terminal to access the /proc/stat file. Use the command cat /proc/stat to view its contents. The first line starts with cpu and shows cumulative CPU time. Numbers represent time units in various modes.
Each number corresponds to a specific CPU state. The order is user, nice, system, idle, iowait, irq, softirq, steal, guest, and guest_nice. These values increase continuously since the system started.
Calculating Usage Manually
To find CPU usage, note the values at two different times. Subtract the earlier values from the later ones. This gives the time spent in each state during the interval.
Calculate total time by adding all the differences. Calculate idle time from the difference in idle and iowait states. CPU usage equals total minus idle, divided by total time. Multiply by 100 to get the percentage.
This manual method helps understand CPU load without tools. It shows how much CPU is busy versus idle. Use this in scripts to track performance over time.
Graphical Tools For Cpu Monitoring
Graphical tools make it easy to monitor CPU usage on Linux. They show real-time data with clear visuals. These tools help you understand how your system uses resources. You can spot issues quickly and keep your computer running smoothly.
Using Gnome System Monitor
GNOME System Monitor is a popular tool on many Linux systems. It has a simple interface that shows CPU usage clearly. You can see graphs that update every second. The tool also lists running processes and their CPU use. It helps you find which programs use the most power.
You can open it from the menu or type gnome-system-monitor in the terminal. The “Resources” tab displays CPU, memory, and network activity. This view makes it easy to track your CPU load over time.
Kde System Monitor Features
KDE System Monitor offers more detailed CPU information. It has a customizable interface with multiple views. You can see CPU usage for each core separately. This helps you understand how tasks are spread across the processor.
The tool also shows graphs for memory, disk, and network usage. You can sort processes by CPU use to identify heavy tasks. KDE System Monitor supports widgets for quick access on your desktop.

Credit: runcloud.io
Automate Cpu Usage Alerts
Automating CPU usage alerts helps keep your Linux system stable. It notifies you when the CPU load is too high. This way, you can act fast and avoid crashes or slowdowns.
Setting up automatic alerts saves time. You don’t need to check the CPU usage manually. You can create simple scripts that watch the CPU load and send alerts.
Setting Up Scripts
Start by writing a small script to check CPU usage. Use commands like top or mpstat for this. The script should compare CPU load to a set limit.
If the load is above the limit, the script sends a warning. You can send an email or a message to yourself. Keep the script easy to read and edit.
Using Cron Jobs For Regular Checks
Cron jobs run scripts at fixed times. Use cron to check CPU usage every few minutes. This keeps your system monitored constantly.
To add a cron job, open the crontab file with crontab -e. Then, add a line to run your script regularly. For example, every 5 minutes.
Cron makes alerts reliable and automatic. You don’t have to start the script yourself. It runs in the background, quietly keeping watch.
Tips To Reduce High Cpu Usage
High CPU usage can slow down your Linux system and cause frustration. Reducing this load helps your computer run smoother and faster. Simple actions can lower CPU use and improve overall performance.
Knowing which processes use the most CPU is the first step. Then, optimizing your system keeps it stable and efficient. These tips help manage CPU resources better.
Identifying Resource-heavy Processes
Use commands like top or htop to see active processes. These tools show CPU use by each program. Spot processes that take too much CPU time.
Look for unknown or unnecessary programs running in the background. These may waste CPU power. Kill or stop these processes to free up resources.
Check for frequent spikes in CPU use. This might indicate a problem with a specific app. Restart or update that app to fix issues.
Optimizing System Performance
Keep your Linux system updated. Updates fix bugs that can cause high CPU use. Use package managers like apt or yum to update software.
Limit the number of startup programs. Too many apps running at boot slow down your system. Disable unnecessary services using systemctl.
Use lightweight alternatives for heavy apps. Simple tools use less CPU and memory. This choice helps maintain smooth performance.
Adjust CPU frequency scaling to balance power and speed. Tools like cpufreq allow you to control CPU speed. Lower speeds save power and reduce heat.

Credit: www.cyberciti.biz
Frequently Asked Questions
How Can I Check Cpu Usage In Linux Terminal?
You can check CPU usage with the top or htop commands. They display real-time CPU stats and running processes.
What Command Shows Detailed Cpu Usage On Linux?
The mpstat command provides detailed CPU usage per core. Install sysstat package if not available by default.
How To Display Cpu Usage Graphically In Linux?
Use system monitors like gnome-system-monitor or KSysGuard for graphical CPU usage charts on Linux desktops.
Can I Monitor Cpu Usage Using Shell Scripts?
Yes, shell scripts using top, mpstat, or /proc/stat can log CPU usage over time for monitoring.
Conclusion
Monitoring CPU usage in Linux helps keep your system healthy. You can use simple commands like top, htop, or mpstat. These tools show real-time data clearly and quickly. Checking CPU usage often prevents slowdowns and crashes. Try different commands to find what fits your needs best.
Stay aware of your system’s performance every day. This habit makes your Linux experience smoother and more reliable.